

Volatility Metrics: VIX9D:VIX:VIX3M:VIX6M:VIX1Y - Fast, medium, slow crossovers
Jun 11, 2019VTS Community,
The cash VIX term structure is in my opinion one of the most useful, yet most overlooked aspects of the volatility complex. So often people want to focus on the VIX futures, and more specifically the level of contango or backwardation of the front two month VIX futures (M1 & M2). I talk about those as well, and as a refresher course you can read a couple of my articles on them here and here. However there is a wealth of useful information packed into the cash VIX term structure that I feel traders are missing out on.
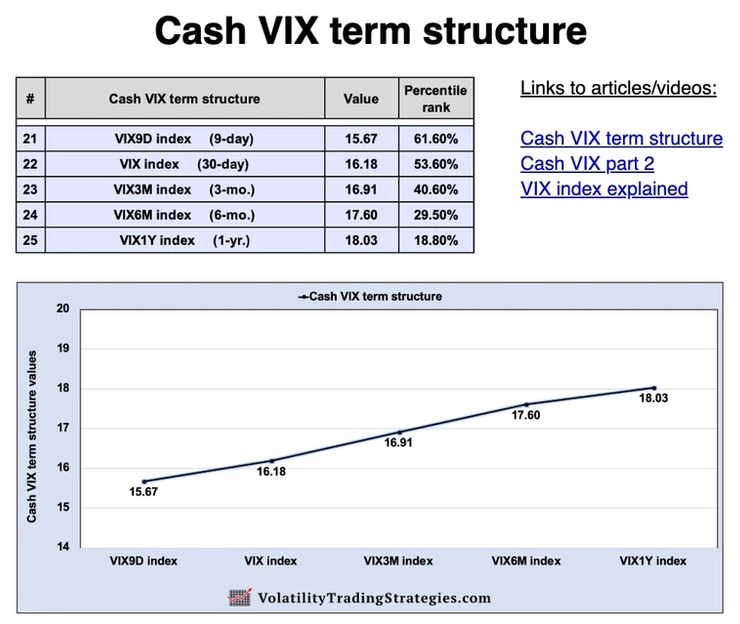
VIX9D: 9-day forward implied volatility
VIX: 30-day forward implied volatility
VIX3M: 3-month forward implied volatility
VIX6M: 6-month forward implied volatility
VIX1Y: 1-year forward implied volatility
As you may know, you can't directly own the VIX index. It's just a statistic, calculated based off a strip of S&P 500 options. This is why it's often referred to as the "cash" VIX. The VIX9D, VIX3M, VIX6M, and VIX1Y are just like the VIX, calculated in a very similar fashion except over different time periods from 9 days to 1 year. They are also just statistical values based off S&P 500 options and aren't indexes that traders can buy. Just like the VIX, they are also "cash" indexes which is why I call it the cash VIX term structure.
* I post it everyday in my morning blog for VTS Community subscribers. It looks like this:
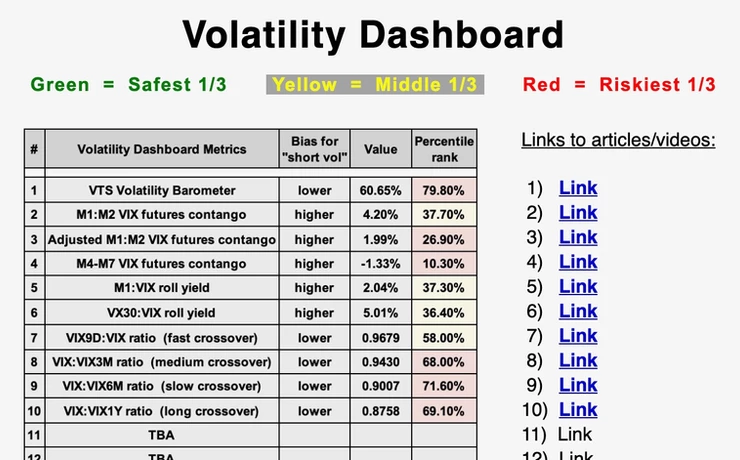
Today I'm going to introduce you to a very cool way to use these metrics that may give traders an edge in timing the market, and it has to do with ratios and crossovers.
VIX9D:VIX ratio (fast crossover)
Since the VIX9D is a 9-day forward implied volatility timeframe, and the VIX index is a 30-day timeframe, the VIX9D tends to be a much faster moving indicator than the VIX. Much like an exponential vs simple moving average, when one of them is more reactive to recent activity, tracking the ratio of the two can be useful to determine when the underlying is on the move. The underlying in this case is volatility. So anytime the VIX9D is trading above the VIX, it can mean volatility is on the move higher.
VIX9D:VIX ratio = VIX9D / VIX
* If the VIX9D:VIX ratio > 1, it may signal that in the short term volatility is moving higher
VIX:VIX3M ratio (medium crossover)
The VIX index is a 30-day forward implied volatility index, and the VIX3M is a 3-month forward implied volatility index. So much the same as the above example, the VIX tends to move much faster in relation to the VIX3M. When the VIX is trading above the VIX3M, volatility is likely on the move higher in a more meaningful way, since it takes more of a move to get the VIX over the VIX3M than it does to get the VIX9D over the VIX.
VIX:VIX3M ratio = VIX / VIX3M
VIX:VIX6M ratio (slow crossover)
The VIX6M is even slower moving than the previous indicators because it's a 6-month forward implied volatility indicator. So when the VIX (30-day) is trading above the VIX6M (6-month) it's something to pay attention to because it doesn't happen as often as the previous ones.
VIX:VIX6M ratio = VIX / VIX6M
VIX:VIX1Y ratio (long crossover)
Lastly the VIX1Y is an indicator that very few people focus on or really even know exists, but it's a 1-year forward implied volatility indicator that for the most part remains above the VIX. Only when markets make a significant volatility move does the VIX go over the VIX1Y, and the times that it does may signify there is some stickiness or staying power to the high volatility environment. That's why I call it the "long" crossover, because it's a more long-term view that is showing potential periods of extended market weakness.
VIX:VIX1Y ratio = VIX / VIX1Y
Example of a typical low volatility environment:
As I said, the typical state of affairs in the volatility market is that each cash index of longer duration trades higher than the previous one with shorter duration. Which is to say, the order of low to high prices in a "normal" market would be as follows:
VIX9D < VIX < VIX3M < VIX6M < VIX1Y
Low volatility environment: Dec 12, 2017 - Jan 12, 2018:
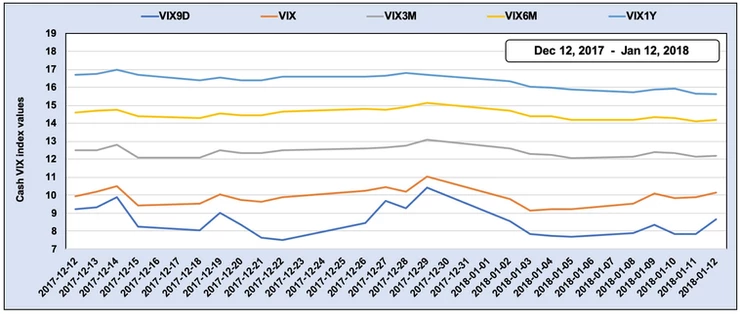
See how each volatility index is below the one with the longer term? Totally normal, and this is why these are such important indexes to keep an eye on. Because when things start to shift, you can see it materialize in this cash VIX term structure.
- The VIX9D can go over the VIX quite easily, anytime there is a minor volatility bump
- The VIX is a little less likely to go over the VIX3M, so pay attention when it happens
- The VIX is even less likely to go over the VIX6M, so pay MORE attention when it happens
- And if the VIX goes over the VIX1Y, it may mean the volatility spike has staying power
Example of a transition from low to high volatility:
Remember February 5th, 2018? If that date doesn't ring a bell it probably means you weren't yet interested in volatility markets because that day will be burned into the memory of all of us volatility traders for the rest of our lives. A single day 115.6% VIX index spike that terminated our old friend the XIV. A lot of people lost significant amounts of capital on that day and if you're one of them, I'm sorry for your losses. These markets are no joke and bad things can happen if we don't have effective signals to move us to safety when needed.
So the question is, using the cash VIX term structure ratios and crossovers (VIX9D:VIX:VIX3M:VIX6M:VIX1Y) could a trader have perhaps seen the Feb 5th event materializing before any major damage was done?
Transition to high volatility environment: Jan 26, 2018 - Feb 12, 2018:
The VIX9D went over the VIX on January 29th, and by February 2nd it was already above the VIX1Y. If that's not a warning signal I don't know what is. By Feb 2nd, the VIX was also well above the VIX3M, again flashing danger.
There was no way to predict that on Feb 5th we would have seen the carnage that we did, but the cash VIX term structure was signalling warning signs the week before, and certainly a few days before.
Now this wasn't the only reason I exited to safety positions in late January 2018 before the Volpocalypse event occurred. In fact there's plenty of other volatility metrics that we also talk about here at VTS that were also flashing warning signs, so we were safely in cash a week ahead of time and just watched the carnage from the sidelines. But the cash VIX term structure signals would have caught it on its own even if that's all a trader focused on, which is important. These are very good signals to keep an eye for especially that reason, they can signal trouble ahead of time.
That "trouble" doesn't always turn into something that large, but on the rare times that it does, it's great to have indicators that can see it coming a little early and get the trader into a safety mindset ahead of time.
Notice in that above chart also, after Feb 5th the cash VIX term structure was perfectly inverted? Meaning the VIX1Y < VIX6M < VIX3M < VIX < VIX9D. When that happens, you know whatever scared the markets is not just a short term blip. It's something to take very seriously.
* And side note, the S&P 500 is basically at the same level now in June of 2019 as it was back in January of 2018. The cash VIX term structure signals being perfectly inverted like that was not something the market could shake off so quickly, especially because it happened again in Q4 2018. Now it's kind of a chicken and egg thing. Did it happen again, or was it more likely to happen again because it already did a few months earlier? Either way, it takes time to work through a volatility scare like that.
Get creative:
I present these signals not as strict guidelines, but more as an additional tool in your trading toolbox. How you use them will be up to you, but I suggest you get familiar with them. Depending on what your time frame is, what your risk tolerance is, what type of strategy you're trying to execute, and what trade frequency you're attempting to abide, you can use one or several of these indicators at once.
The VTS Community sees the raw values as well as the percentile rank of that value every morning in my daily blog along with a multitude of other important volatility metrics. If you want to join our group you're always welcome. In the VTS community we put personal market predictions aside and only focus on mathematically quantifying what's happening in these unruly markets, to increase the probability we are on the right side of the trade.
Take Control of your Financial Future!
Profitable strategies, professional risk management, and a fantastic community atmosphere of traders from around the world.
