

Volatility Metric: M1:M2 VIX futures - Contango / backwardation and Volatility ETP
Apr 15, 2019VTS Community,
I'm going to do something a little different today. I'm going to start my article with the conclusion, and then everything that follows is the more detailed explanation of how I arrived at the following simple statement:
Conclusion: M1:M2 VIX futures contango is 15.23% on Apr 15, 2019, which is the 95th percentile of all previous values. All things being equal, this may be a tailwind and an advantage for a short volatility position (examples: long SVXY, short VXX, or long VXX puts)
If what I just said is intriguing to you, read on my friend :)
Within the "volatility trading" realm, the VIX futures are one of the most referenced of metrics out there, likely only outdone by the VIX index itself. Here is an excerpt straight from the CBOE website:
"Introduced in 2004 on Cboe Futures Exchange (CFE), VIX futures provide market participants with the ability to trade a liquid volatility product based on the VIX Index methodology. VIX futures reflect the market's estimate of the value of the VIX Index on various expiration dates in the future. VIX futures provide market participants with a variety of opportunities to implement their view using volatility trading strategies, including risk management, alpha generation and portfolio diversification."
The VIX futures term structure
To keep this article simple and to the point, let me just assume you're not going to be buying and selling VIX futures directly. I'll get to a more advanced article at a later date for that.
Having said that, the VIX futures are still a vital aspect of the volatility markets that traders need to understand. The most common way we view VIX futures are by what's called the VIX futures term structure. Below is the VIX futures term structure for Apr 15, 2019, taken directly from www.vixcentral.com <--- easy website to read
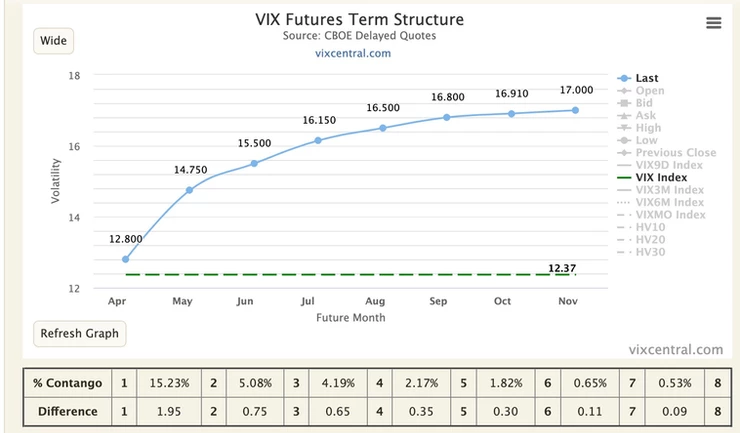
Each one of those dots represents a monthly contract. The first dot (12.800) is the front month future for the April expiry. The next dot (14.750) is the May expiry for next month. June (15.500) is the one after that. Every dot represents a monthly contract further out in time. You can see there are 8 in total going from April through November. Typically we refer to these as M1 - M8, representing "month 1, month 2... month 8." You may also hear people call them VX1, VX2... VX8, it's the same thing. I personally use M, so if you're following my work you can get used to hearing M1, M2.... M8.
This is the VIX futures term structure. If you're just starting your volatility trading journey, get in the habit of checking VIXcentral every day and viewing the term structure as it's an important starting point to build from. Some of the data points I talk about and include in my daily emails are in some way related to VIX futures.
Contango / backwardation:
The reason viewing VIX futures graphed on a chart is so useful is because it allows us to view at a quick glance the slope of the term structure. Depending on the shape of that line, we can gain useful information of the current state of volatility.
M1:M2 VIX futures "Contango" (Apr 15, 2019)
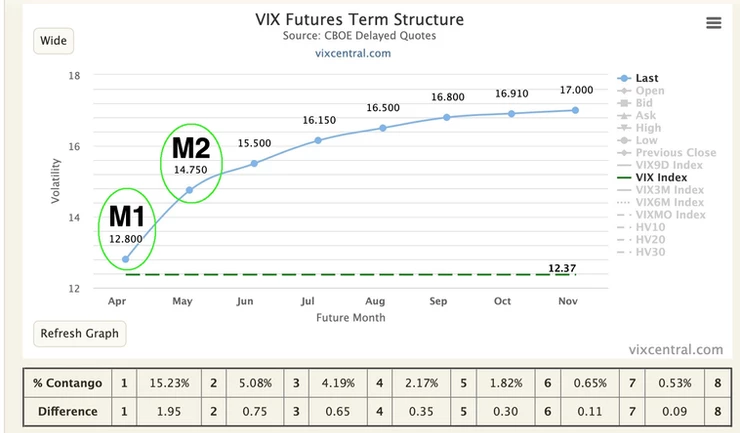
Upward sloping to the right - Contango.
It's when the longer term VIX futures values out to the right are higher than the shorter term values. This is the normal state of affairs and it makes sense right? With more time comes more uncertainty. More unexpected things can happen from now to the M8 November future as they can from just now to M2 in May.
So in a normal market, traders need to be compensated for taking on the additional risk of future unknown events.
Most of the time, the longer dated VIX futures should be priced higher than shorter dated ones. This means the normal state of affairs is contango.
M1:M2 VIX futures "Backwardation" (Dec 24, 2018)
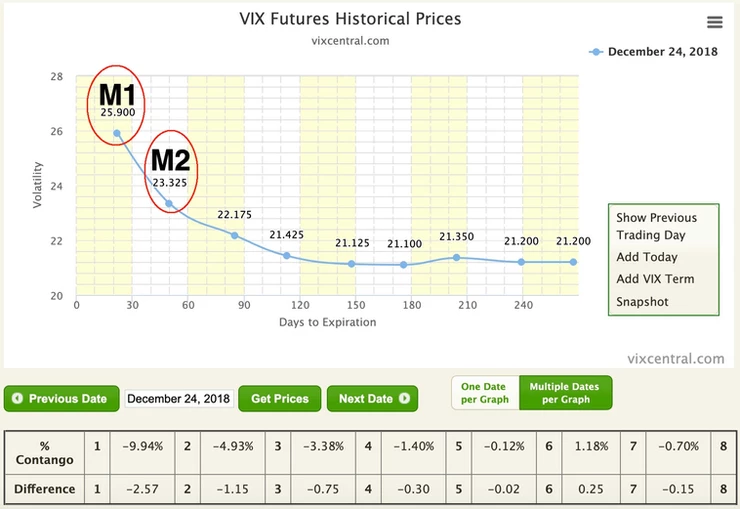
Downward sloping to the right - Backwardation
At times of elevated volatility and market fear, the shorter dated VIX futures can be priced higher than longer dated contracts. During extended market sell offs such as the European debt crisis in 2011, and especially recessions such as 2008/09, backwardation can persist for several months.
The picture above is from Dec 24, 2018 which was right at the bottom of that -20.2% market crash in the 4th quarter of 2018. Given the severity of the crash, it's not surprising at all to see the VIX futures term structure in backwardation with front months substantially higher than back months.
What are volatility ETPs?
Exchange traded products are a type of security that are derivatively priced on other investment instruments. So for example, the worlds largest ETP is the SPY, which is derived based on the S&P 500 index.
The "volatility" ETPs are similar, just more specific to volatility. So products such as VXX and SVXY are derivatively priced based on VIX futures contracts.
It is very important to understand that the volatility ETPs do not derive their price based on supply and demand of the product itself.
That is to say, VXX's price is not derived based on how many people buy or sell VXX. Instead, it actually derives its price based on the values of the underlying VIX futures that the product is based on. In the case of VXX, the front two months of the VIX futures (M1 & M2)
Based on the relationship between the M1 and M2 contracts and how those converge to the spot VIX index price at expiration, the volatility ETPs such as VXX derive their price. That pricing mechanism is beyond the scope of this article, but in general:
- If M2 > M1, this is contango, and all other things being equal may be a tailwind for short volatility (short VXX or long SVXY)
- If M1 > M2, this is backwardation, and all other things being equal may be a tailwind for long volatility (long VXX or short SVXY)
* Note: VIX futures are just a snapshot in time representing the current moment and are not predictive of future prices. For that, a more comprehensive view of volatility, and a multitude of metrics used together will increase the probability of forward success.
Long-term statistics:
Like I mentioned above, because of the increased uncertainty, traders need to be compensated for taking on the additional risk further out in time. Which means that an upward sloping term structure (contango, where M2 > M1) is the normal state of the VIX futures market. You can see it on a long term chart going back to inception:
M1:M2 VIX futures contango since Mar 26, 2004
Most of the time that M1:M2 relationship is above 0% and in contango. Only during periods of elevated fear do the VIX futures dip into negative territory and into backwardation. This is typically (but not necessarily) when broad markets and the S&P 500 are crashing.
General statistics on VIX futures since Mar 26, 2004
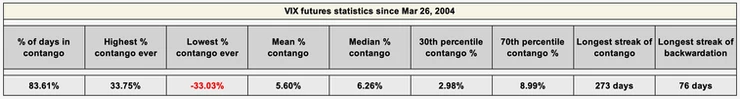
A few interesting statistics. Since 2004, contango was present the vast majority of days at nearly 84% as of Apr 2019. The average daily contango level is around 5.6% with the median being slightly higher at 6.3%. There was a period in 2004/05 where contango lasted 273 trading days which is more than a year. In 2011 during the European debt crisis, backwardation persisted for a record 76 trading days straight.
A common threshold people look at for technical analysis (like Relative Strength Index for example) uses 70/30 levels. So specific to the VIX futures, below 2.98% contango is actually in the bottom 30% of values, and above 8.99% is in the top 70%.
Average M1:M2 contango per year and benchmark return
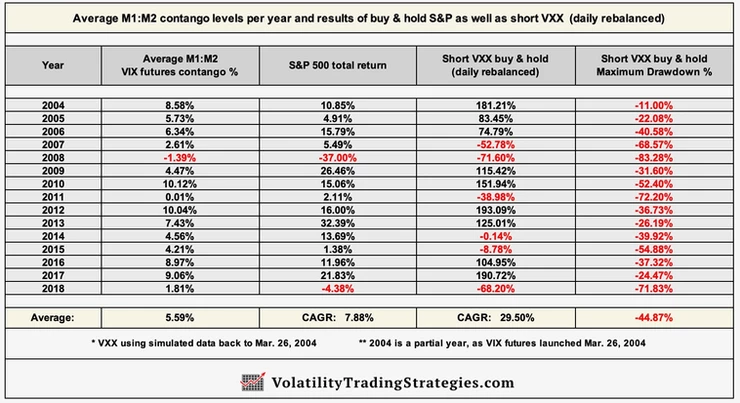
If you look at those numbers above, you can see a clear relationship between the average M1:M2 contango levels in any given year and the performance of shorting the most popular volatility ETP called VXX.
- Higher average contango years such as 2010, 2012, and 2017 all led to an impressive return shorting VXX (albeit with substantially large drawdowns)
- Lower average contango years such as 2008, 2011, and 2018 led to abysmal returns shorting VXX (with portfolio melting drawdowns)
Why 0% contango is NOT a viable trading signal:
I've written extensively on this topic in the past because there are far too many "volatility tourists" on Twitter trying to sound smart by saying that if the VIX futures are in contango you short volatility and if in backwardation you go long volatility. That is ill-advised and very un-researched advice. Just a friendly tip, anybody you see posting anything of the sort should be ignored, they clearly have not put the work in.
Now rather than let this article get too long, I'll leave a link for an article I wrote on this subject both on my website as well as Seeking Alpha. I highly recommend you read it after this one as it clearly lays out the reasons why 0% contango should not be taken seriously as a trade signal. There are charts and statistics galore in that article proving my point.
VXX and why following VIX futures contango signals may fail
What are percentile rankings?
The volatility dashboard (available every morning for VTS community members) shows both the absolute value of M1:M2 VIX futures contango as well as what percentile ranking that corresponds to for all values going back to the launch of VIX futures on Mar 26, 2004.
As some of the statistics charts above have shown, there is a correlation between the level of M1:M2 contango and the subsequent performance of shorting volatility. However the actual level of contango does matter. 0% is not a viable signal in part because that's only the 16th percentile of previous values. I for one would not be shorting volatility 84% of the time as that would lead to excruciating drawdowns.
Filtering for higher quality signals may lead to better performance, so the percentile ranking is quite relevant. The current level of contango is 15.23% which corresponds to the 95th percentile. Contango rarely gets higher than it currently is.
* But tune tomorrow to my next article where I'll demonstrate why VIX futures contango is not actually as high as it currently appears...
Conclusion:
Always keep in mind, it does not matter how strong or popular a specific volatility metric is, it's still just one cog in the overall wheel that is the volatility complex. M1:M2 VIX futures contango is definitely important and should be understood and viewed everyday for anybody who wants to be trading volatility ETPs.
However, on its own, it's a non-starter. The drawdowns that would result from following simplistic signals are just too high for any reasonable investor to tolerate. Success in this space only comes from a comprehensive understanding of the dozens of volatility metrics out there and how they all interact with each other. And most importantly, several layers of risk management in place for when markets don't cooperate.
The VTS Volatility Barometer and Volatility Dashboard in my daily emails are my way of introducing these complicated indicators, hopefully in a way that's a little easier to understand, but pace yourself. I've been at this for nearly 15 years now and I am still learning new things myself. If you're just beginning your journey, congrats, enjoy it! And if I can help you speed up the process and gain success quicker all the better.
Follow my daily emails, watch my Youtube videos, ask questions, and together we'll make you a highly successful investor in due time...
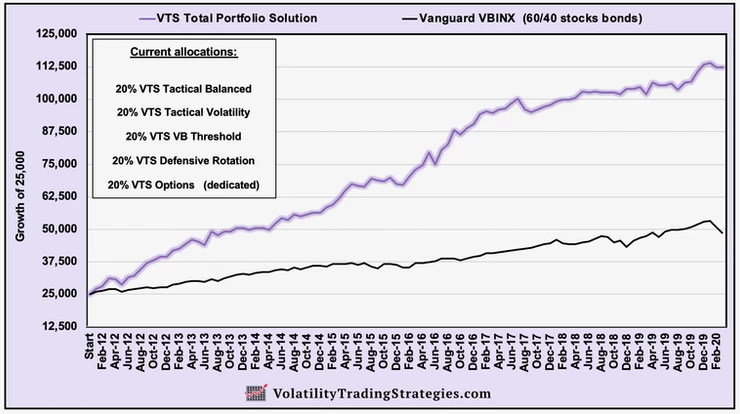
VTS Total Portfolio Solution updated through March 2020:
Take Control of your Financial Future!
Profitable strategies, professional risk management, and a fantastic community atmosphere of traders from around the world.
