

Volatility Metric: M4-M7 VIX futures contango - Is ZIV the best Vol ETP?
Apr 23, 2019VTS Community,
Whenever volatility ETPs are being discussed, the vast majority of the time it's the VXX, UVXY, SVXY, even TVIX. And of course in the past a lot of the focus was on our fallen hero the XIV, before its unfortunate termination on Feb 5th, 2018
But how often do you hear people talk about ZIV?
Not often right? In fact, I think I personally do a fair bit of the heavy lifting when it comes to spreading the word about ZIV. Very few of the other volatility strategists out there have ZIV specific strategies, and most of them don't even mention it in any of their articles. As someone who's been trading vol ETPs since they launched nearly 10 years ago, would it surprise you to hear that the ZIV is my favourite product? I have nothing against VXX and UVXY, I trade those very often as well, but ZIV is in a class by itself.
In fact, I'd go as far as saying the ZIV may be the best financial product on the market from a risk reward perspective.
What makes ZIV different?
All the other popular volatility ETPs that I mentioned above (VXX, UVXY, TVIX, SVXY, and the old XIV) are products that derive their price based on a composition of 1st and 2nd month VIX futures contracts, also known as M1 & M2 VIX futures (or VX1 & VX2)
If you're not familiar with those, I suggest you start with my full explanation article here
Now the ZIV also derives it's price based on a composition of VIX futures, but what makes it unique (and superior) is that the futures used are actually the 4th - 7th month futures, or M4 - M7. Let's check out the VIX futures, taken from vixcentral.com
VIX futures term structure on April 22, 2019:
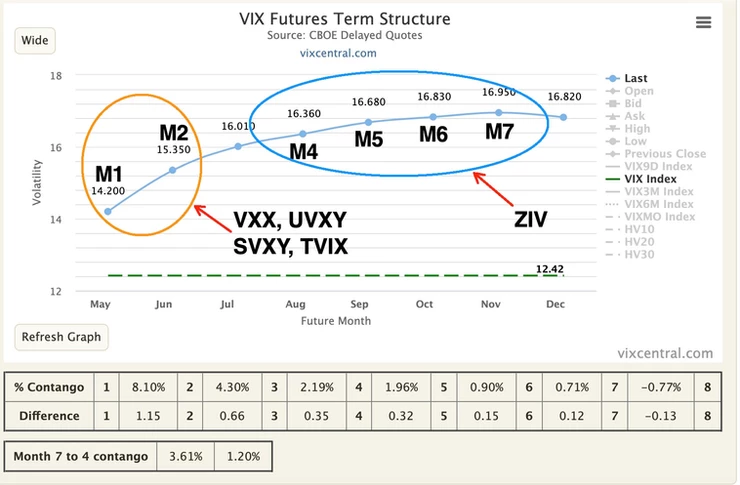
So you can see the ZIV is the loner of the group, focusing on the 4th - 7th month of the futures for its calculation. The reason this matters is because the slope of the VIX futures curve is typically flatter further out in time at M4 - M7 compared to the front end of the curve at M1:M2.
Based on the method the product derives it's price, this means in the long-run the daily fluctuations of ZIV are normally smaller than the other products.
It tends to go up less on good days, and go down less on bad days. If you follow my work, you already know why this is a game changer. Remember the profound quote from that very famous volatility strategist:
"Losses are more costly to a fund than gains are beneficial" - Brent Osachoff
Joking of course, I'm not famous, but my point is that by far the most important aspect of successful long-term investing is limiting losses and reducing drawdowns. The ZIV has that built in to its methodology. It's a safer product by very design, and that my friends is why it's the best product on the market.
1) It gives us potential for explosive growth if traded correctly
2) It has risk management built right into it.
Remember Volmageddon? Volpocalypse? Volnado? I'm talking about that fateful day on February 5th 2018 when we lost the XIV. Here's the performance of the three main inverse volatility ETP's from Feb. 2, 2018 - Feb. 6, 2018
XIV: -93.64% SVXY: -88.41% ZIV: -19.80%
Now while a -20% decline in 2 days isn't exactly a picnic, ZIV clearly weathered the storm far better than the front month M1:M2 products did. So well in fact, that it may give ZIV a leg up in the performance department for many years to come.
XIV vs ZIV from Nov. 30, 2010 - Feb. 15, 2018:
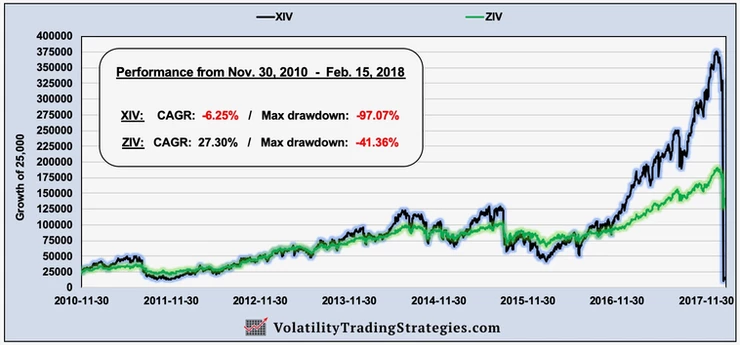
You can see in the chart, every time there was a major drawdown in the XIV, the ZIV overtook it in performance. In 2011 the ZIV overtook the XIV during the European debt crisis. In 2014 it caught up and passed XIV. In 2015 as well it was above during that extended S&P 500 crash. And again after the February 2018 "incident" the ZIV just keeps plugging along.
Why is the ZIV more consistent?
The pricing mechanism with these volatility ETPs is beyond the scope of this introductory article, but in general the more time the VIX futures spend in stable periods, that may lead to better performance in the vol ETPs.
M4 - M7 VIX futures spend more time in contango, and the fluctuations when there is a short term scare in the broad markets are more contained.
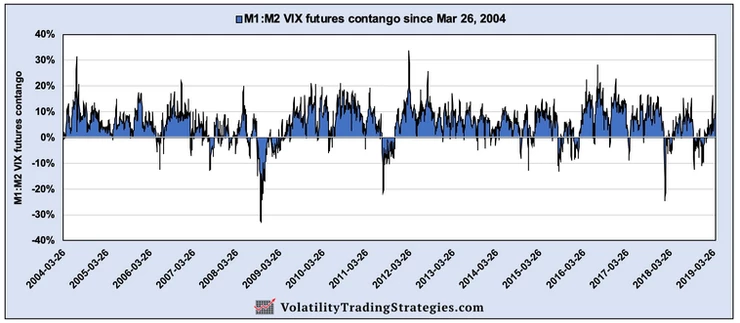
M1:M2 VIX futures since inception:
M4 - M7 VIX futures since inception:
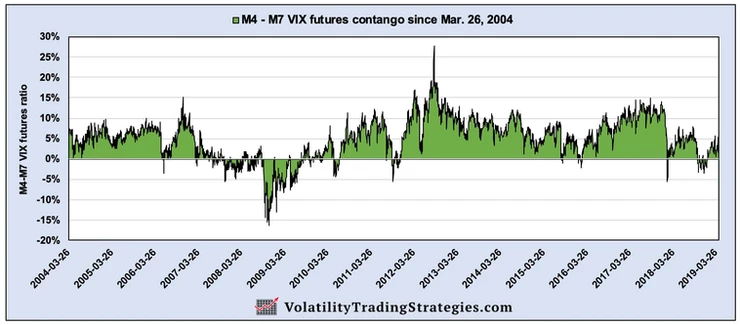
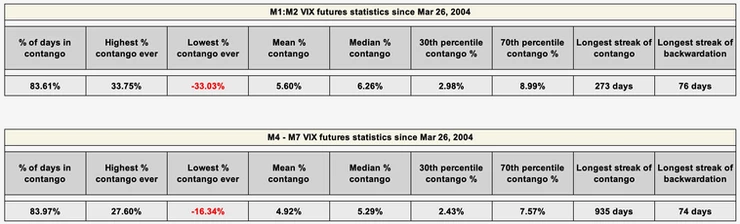
You can see most of the M4 - M7 backwardation periods were contained to the financial crisis in 2008/09. The rest of the time it was actually very stable and this is one of the reasons the ZIV has performed so well over time.
Since January 2010, M4 - M7 VIX futures have spent 93.6% of trading days in contango, with the longest duration of backwardation being only 34 days. Compare that to M1:M2 VIX futures at 86.3% of trading days in contango, and several longer periods of backwardation.
Recent example of SVXY : ZIV divergence:
The SVXY, which used to be a 1x front month M1:M2 product was reduced to 0.5x leverage factor in the aftermath of February 2018, so now it aligns much closer with ZIV. So let's look at their 1 year performance.
1 year of SVXY vs ZIV (May 18' - Apr 19')
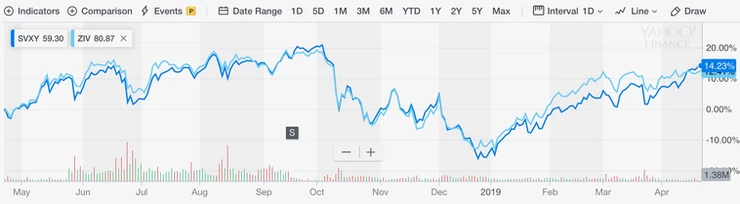
They've been very close the past 1 year, and as long as the SVXY's leverage factor stays at 0.5x, this will continue. But remember they are getting information from two different parts of the VIX futures curve. SVXY is M1:M2, and ZIV is M4 - M7.
1 month of SVXY vs ZIV (Mar. 22 - Apr. 22)
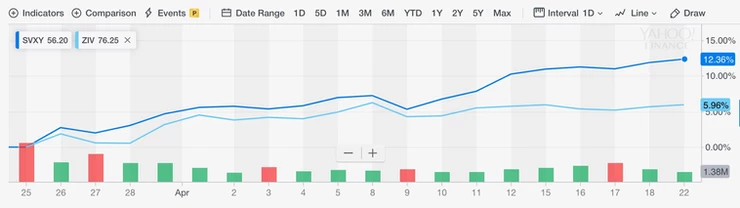
ZIV is lagging significantly in the last 10 days. What gives?
Keep an eye on the M4 - M7 VIX futures:
The VTS Volatility Dashboard that's included in my blog every morning for subscribers shows both the M1:M2 and M4 - M7 VIX futures statistics (among many other of my top volatility metrics). Now the absolute value is meaningful, but it's really the percentile rank that's the most useful. That's how you can tell whether it's actually high or low, is to compare it against itself of the past.
VTS Volatility Dashboard with only the relevant VIX futures:
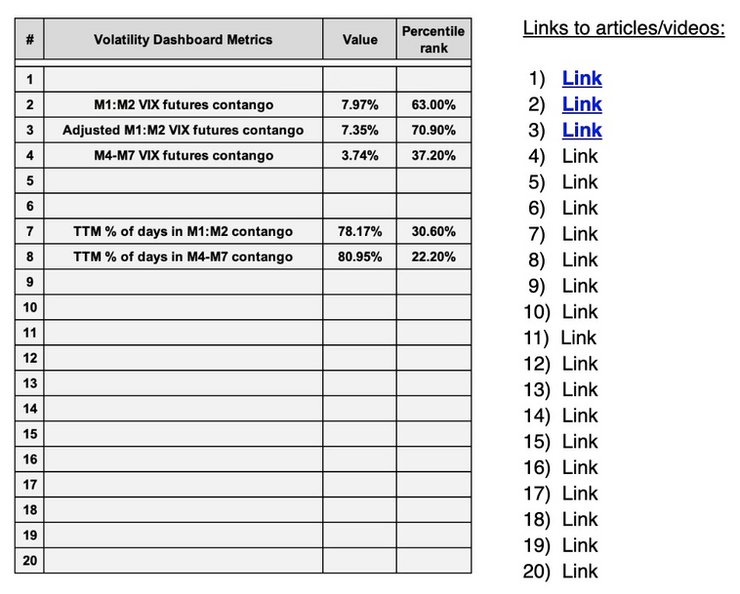
Can you see the percentile ranking of M4 - M7 VIX futures lately? Only 37%, meaning that 63% of trading days going back to inception had higher levels than we currently see. And the absolute value itself of 3.74% is well below its long term mean of 4.92%.
Now there are other factors involved, but the low contango may harm it's short term performance compared to the much stronger M1:M2 VIX futures contango that is currently around its 60th percentile.
And also watch the cash VIX term structure:
Another important metric, which is also included in my morning blogs, is the VIX index instruments of different time intervals, the cash VIX term structure.
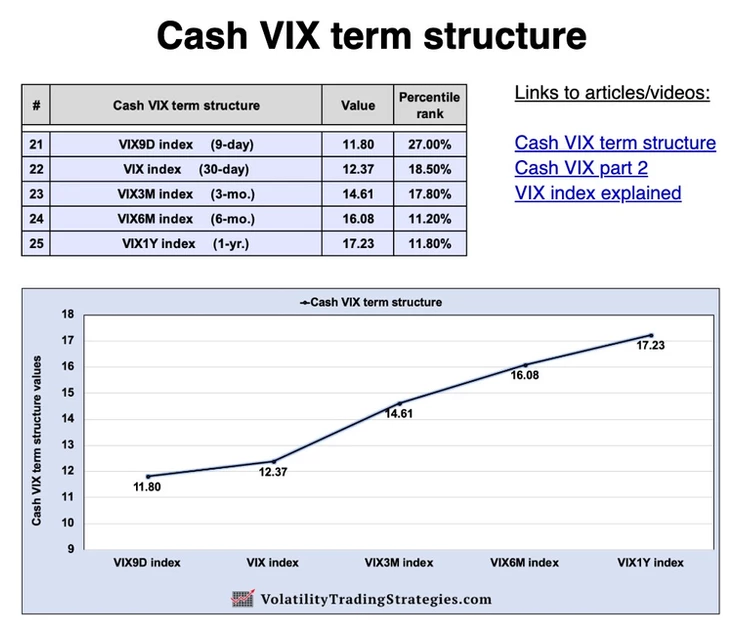
Notice how the percentile ranking of VIX3M (18%) VIX6M (11%) and VIX1Y (12%) are low compared to the front end VIX9D (27%) and VIX (19%)? This reflects a VIX futures curve that may be flatter at the far end, which will mean the upside potential of ZIV may be muted recently compared to SVXY.
Now remember, risk is a double edged sword, so while it may go up less as long as this relationship stays, it will also likely go down less if there is a problem in the market.
That's the built in risk management of ZIV
Conclusion:
Is ZIV the best financial product in the world? Maybe, and for what it's worth I happen to think so. But at the very least, I think it's worth a spot on peoples radar going forward.
The 4th - 7th month VIX futures (and ZIV) may be a more accurate barometer of the overall health of the economy than the short term M1:M2. More consistent, with a more long-term view of what may be coming.
I've been trading it for over 7 years now, so I invite you to give it a seriously look as well. If your investing philosophy is similar to mine and you do value safety and consistency above all else, then ZIV may be tailor made for you.
Take Control of your Financial Future!
Profitable strategies, professional risk management, and a fantastic community atmosphere of traders from around the world.
