

Volatility Metric: VTS VXX Crush level
Jan 21, 2020On January 30th, 2009 the volatility landscape changed forever with the introduction of the world's first volatility exchange traded product, the VXX. Since then, it has had what can only be described as catastrophically bad performance.
VXX since inception (logarithmic scale)
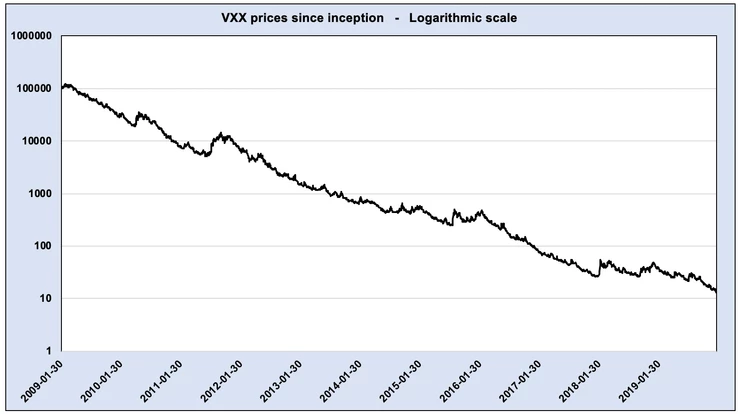
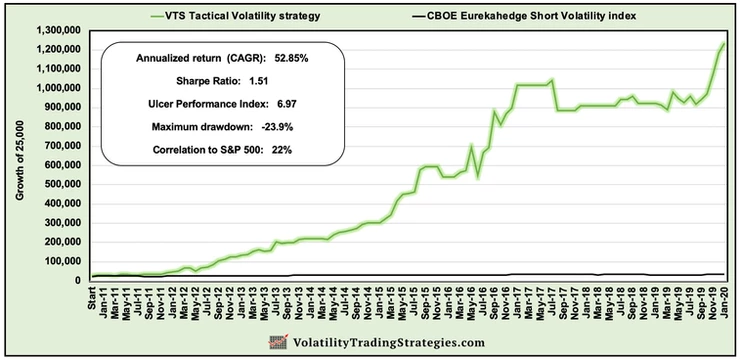
That atrocious chart very succinctly illustrates why "shorting volatility" is so popular. I have many volatility metrics that I share with the VTS Community that we apply as filters to determine the best times to short volatility, and when it may be best to remain safely in cash waiting for better opportunities. My Volatility ETP specific VXX strategy is called Tactical Volatility and it just had its 8th anniversary since launching in January 2012.
Video explanation of the Tactical Volatility strategy
Several of the metrics I include in the VTS Volatility Dashboard are specific to timing proper entries and exits for that strategy, plus several other strategies that we have here at VTS. That is after all the main problem that traders are trying to solve when navigating the "short vol" space. When to short, and when to be in cash.
Today I want to introduce a metric to the Volatility Dashboard that can be used to gauge the current expected daily decay of VXX.
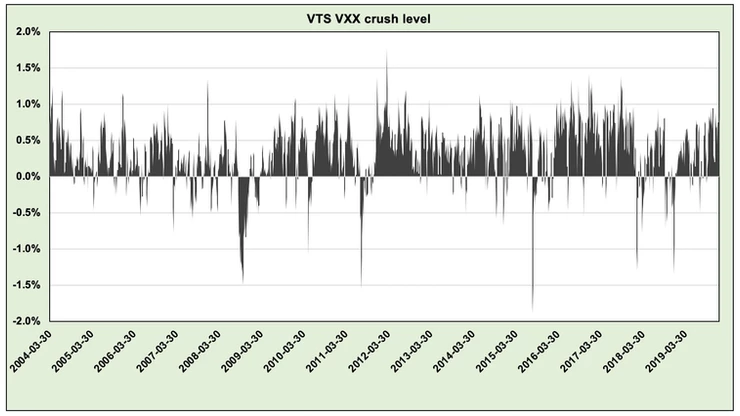
VTS VXX crush level
* don't forget to follow me on Twitter: @VolatilityVIX
The expected daily decay of VXX is a topic that is very often misunderstood. I can't tell you how many times I've seen people on Twitter talking about the decay of VXX in terms of absolute levels of contango.
* If you need a refresher course on contango and backwardation you can check out this article, M1:M2 VIX futures contango
The most common mistake I see being made is traders dividing the current level of M1:M2 contango by the # of days in the current expiration cycle, and they think this gives them a good approximation of how much the VXX should decay in one day.
Example (remember, this is not the right way to do it)
Assume current M1:M2 contango: 20% # of trading days in current cycle: 20
Expected daily VXX decay: 20% / 20 = 1.0% / day
It may look fine on first glance, but there is a major problem with this calculation. You get bonus points if you already know why!
VXX doesn't hold equal amounts of M1 & M2 VIX futures
Since Monday Jan 20 is a holiday and VIX futures expire after trading on Tuesday (minus the Wednesday morning settlement voodoo) that means there is just 1 day left on the current VIX futures expiration cycle.
Here's how much of each future the VXX is currently holding. With 1 day left to expiration, VXX is only holding 4.55% of the front month VIX future, and 95.45% of the back month future.
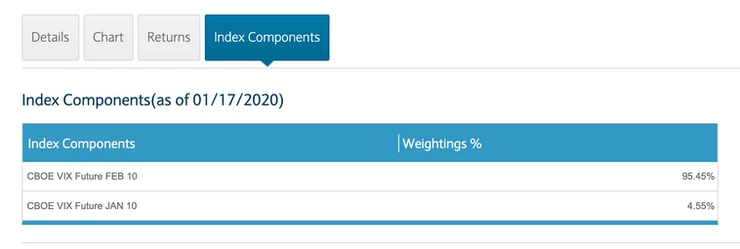
So how useful is it to use a calculation for M1:M2 contango when nearly none of the VXX is holding M1? The answer is, not useful at all. If a person were to use that crude formula of contango / days, they would have a big problem wouldn't they? They would get wildly inaccurate numbers at various times of the monthly cycle depending on how much of each VIX future the VXX was currently holding.
With VIX futures expiration coming up in 1 day we are expecting a huge drop in M1:M2 contango from Tuesday to Wednesday.
* Refresher course on VIX futures expiration cycles
Here is the current VIX futures term structure from everyones favourite website, vixcentral.com

All else being equal, we could easily see M1:M2 contango go from the current 18.80% to just 3.02% a day later. That is an insane drop in contango, but is it because anything has fundamentally changed in the market? No of course not, it's just the simple passage of 1 calendar day.
Here's how big the mistake would be using that incorrect formula (again, in my opinion this is not the correct way to do it)
Tuesday: Current contango: 18.80% # of days in cycle: 22
- VXX daily decay on Tuesday: 0.85%
Wednesday: Expected contango: 3.02% # of days in cycle: 19
- VXX daily decay on Wednesday: 0.16%
That is a HUGE difference for just the passage of a single calendar day. Are we to assume that the VXX decay factor will be over 5 times less on Wednesday than it is on Tuesday? Again, no we shouldn't.
Fortunately the issuer of VXX understands what a problem that would pose and has it solved by rebalancing the VIX futures it holds on a daily basis to maintain a constant one month maturity VIX future. So there is no large jump in VXX decay simply due to the passage of a single calendar day. That formula that we see so often plastered around showing contango/days is wrong. It's actually only correct on 1 single day out of the monthly cycle, and for every other day it's varying degrees of wrong, to the point where it could be hundreds of percent off at certain times.
Introducing the metric: VTS VXX crush level
* Don't forget to follow: VTS YouTube channel
So how do we approximate how much daily decay we can expect in VXX given the current VIX futures that it holds? For that, we need our trusty formula we use often here.
VX30:VIX roll yield
* explanations of VX30:VIX roll yield here in both Video and Article form
The actual methodology of the VXX uses a constant one month maturity VIX futures contract which can be calculated as VX30. It takes into account the number of days to expiration and therefore, it reflects how much of each of the M1 and M2 VIX futures the VXX is actually holding at any given time.
With that, the daily movement in VXX is just a reflection of the changing values of that VX30 in relation to the spot VIX index. That's how VXX changes value. It's because those futures it holds are changing value as they move through time, and we can also gauge which way the value changes are likely to go. In general:
-
If VX30:VIX is positive, meaning M1:M2 VIX futures are in contango and trading above the VIX index, that will tend to pull the futures down converging towards the spot VIX, causing VXX to lose value.
-
If VX30:VIX is negative, meaning M1:M2 VIX futures are in backwardation and trading below the VIX index, that will tend to pull the futures up to converge to the spot VIX, causing VXX to gain value.
But to accurately represent the expected daily VXX decay, we need to account for:
-
The actual VIX futures that VXX is holding
-
The days to expiration in the current cycle
-
Those VIX futures and their relation to the VIX index.
Contango and backwardation are the trend, but they aren't the actual methodology.
Volatility Dashboard metric: VTS VXX crush level
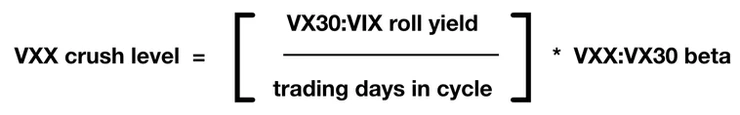
VX30:VIX roll yield = weighted average M1 & M2 VIX futures taking into account days to expiration, and those in relation to VIX
Trading days in cycle = Excluding weekends and holidays, the number of days in the current VIX futures cycle
VXX:VX30 beta = Beta shows how much something moves in relation to something else. I'll save that for a full article on its own, but since the movements don't track 1:1 I add in the beta for a better reflection.
Let's go through the same example as before, but this time we'll do it with this new formula that I believe is much more accurate:
Tuesday: Current VX30:VIX roll yield: 22.55% Current VXX:VX30 beta: 83.3% # of days in cycle: 22
- VXX daily decay on Tuesday: 0.85%
Wednesday: Estimated VX30:VIX roll yield: 21.41% Current VXX:VX30 beta: 83.3% # of days in cycle: 19
- VXX daily decay on Wednesday: 0.94%
The only reason there is a small difference is because with fewer trading days in next months cycle, the estimated decay will be a little more each day, but overall there isn't much expected change in VXX on Wednesday.
Now obviously that doesn't mean it can't go up. Remember, markets are free to move around so whatever happens Wednesday is the result of market action on Wednesday, and there actually have been a few instances in the last couple years where VXX saw massive price spikes right after expiration. But that's not because of contango or backwardation, that's due to market action outside of these formulas.
In general, if the VIX futures term structure remains stable, then traders shouldn't expect a whole lot of change in VXX decay day to day either.
It's just not accurate to think the VXX is somehow a ~500% less leveraged product from one day to the next simply because the calendar switched over. Remember, VXX accounts for this problem already by regularly rebalancing the VIX futures it holds to progressively hold less of the front month and more of the back month as the monthly cycle moves forward. This formula for VXX crush level reflects that.
As of January 17th, 2020:
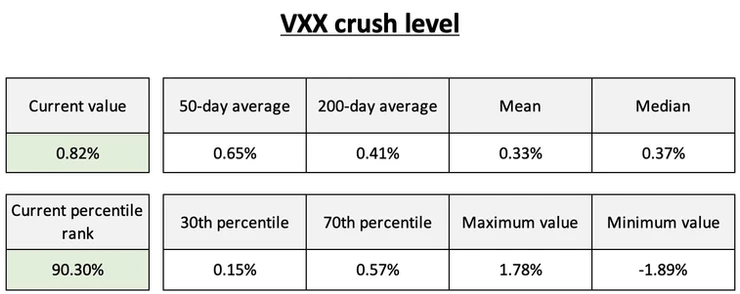
We're in a high point right now with VXX crush pretty significant the last few weeks. It's inside the 90th percentile of all previous values. If a trader were to use the incorrect formula of contango/days, they may falsely assume that the daily VXX decay is going to be around 0.16% on Wednesday. You can see in the table above, 0.16% would be around the 30th percentile.
So is VXX daily decay going to go from the 90th percentile to the 30th percentile simply because the passage of 1 calendar day? No, it's not. All else being equal from Tuesday to Wednesday, VXX will still be juiced and the decay will continue as long as this market remains calm. If we get a pullback, VXX is free to rise. Until then, as long as the VX30:VIX roll yield remains high, VXX is ready to continue its familiar path of destruction.
VXX crush level will be shown every day in the VTS Volatility Dashboard, both its absolute value and the percentile rank.
Take Control of your Financial Future!
Profitable strategies, professional risk management, and a fantastic community atmosphere of traders from around the world.
