

Options Trading 101: Part 5 - Why I prefer 90% Iron Condors
Feb 08, 2017In a previous article I explained why it’s more advantageous to be the net seller. They are Theta positive which means they profit through time decay and the passage of time. However there are many ways to go about selling Iron Condors and there are many different ways to manage them during the life of the contract. In this article I’d like to dig a little deeper into one of the biggest points of contention within the Iron Condor trading community.
70% probability vs. 90% probability Iron Condors
Calculating the probability of success of a given Iron Condor is pretty straightforward. You just divide the premium sold by the difference in the short and long strike prices and convert that into a percentage. Below is a hypothetical example of an Iron Condor:
January 2013 Iron Condor (122 / 124 / 153 / 155) @ 0.20$
The difference in the short and long strike prices is 2$ and the premium sold was 0.20$.
100% – ( ( 0.20 / 2 ) * 100 ) = 90%
This is considered a 90% probability trade. An example of a 70% probability trade would be an Iron Condor where the premium sold was closer to 0.60$.
100% – ( ( 0.60 / 2 ) * 100 ) = 70%
-
The biggest advantage is that 90% probability trades are going to have much wider wings which means a lot more of them are going to be profitable.
-
The disadvantage lies in the fact that although both 70% and 90% trades risk losing more money than they can potentially make, 90% trades are even more skewed to the loss side.
This is why I say it’s a point of contention within the Iron Condor trading community. There are both mathematical and conceptual reasons to support arguments from people on both sides of the debate. There is no “right answer” in this case so it just comes down to the personal preference of the trader.
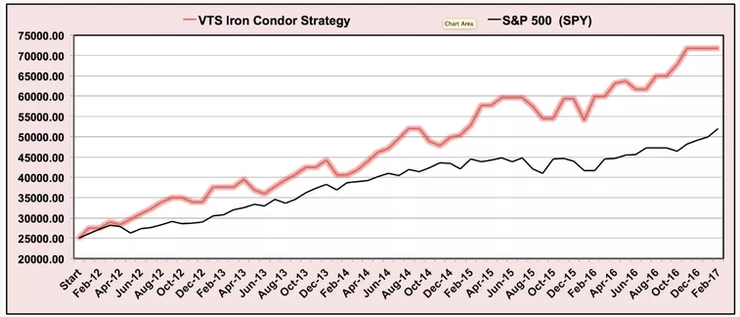
I much prefer 90% trades and the VTS Iron Condor strategy only takes 80-90% probably trades.
Let’s go through some examples from January, February, and March of 2013. (note that we didn’t actually take the February or March trades due to volatility conditions)
January 2013: (90% trade on top, 70% trade is below it)
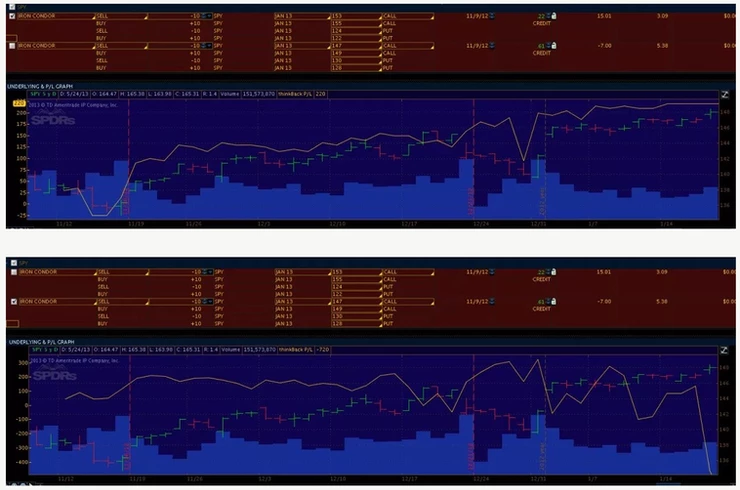
Looking at the daily profit curve on the bottom of these pictures (represented by the yellow line) you can see that the January 90% trade was steadily increasing in profit until achieving its full profit at expiry. However the 70% trade was fairly flat throughout its life and then ended up with a total loss of invested money.
February 2013: (90% trade on top, 70% trade is below it)
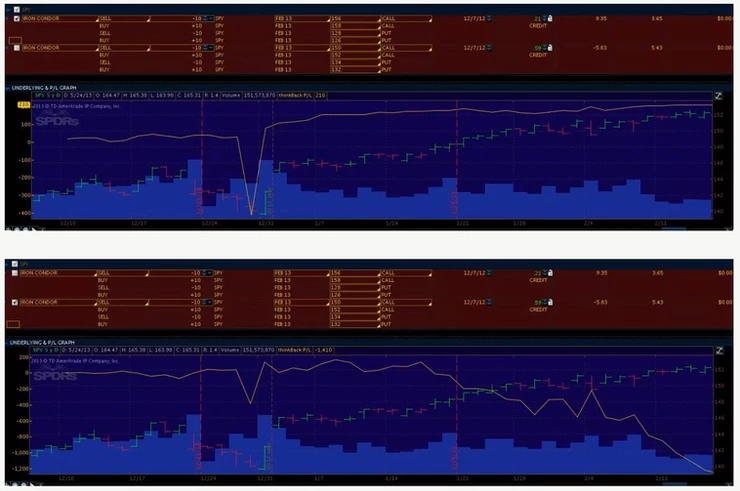
Again you can see that the yellow daily profit curve for the 90% trade above was uneventful, gradually increasing until achieving its maximum profit at expiry. The 70% trade however was slowly declining and ended up with a total loss of capital by the expiry date. (note that the big spike down there was just a bad price print in the computer system. It didn’t actually spike like that)
March 2013: (90% trade on top, 70% trade is below it)
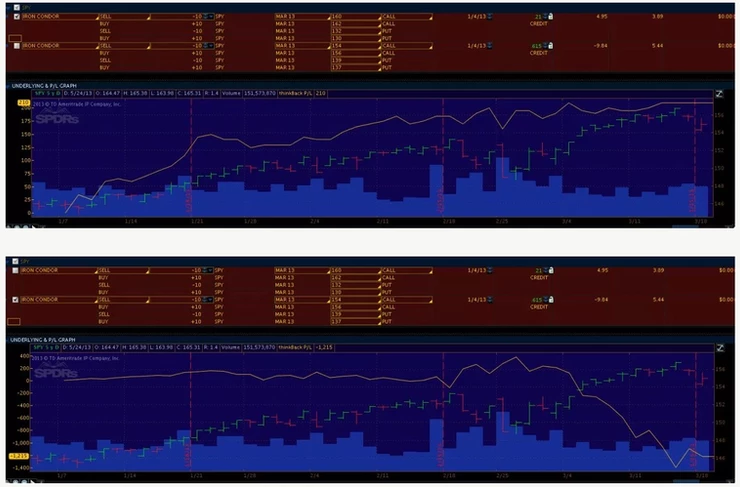
And once again in March the 90% trade was perfectly uneventful leading to a full profit while the 70% trade steadily declined until reaching its maximum loss at expiry.
Now obviously this only represents 3 months and isn’t a large enough sample size to draw definitive conclusions either way, but it does show that all else being equal the 90% probably trades will be successful more often than 70% ones and are safer in the long run. Since the VTS Iron Condor Strategy is all about risk management, the strategy always strives for far more winners than losers rather than going for larger single monthly gains.
Take Control of your Financial Future!
Profitable strategies, professional risk management, and a fantastic community atmosphere of traders from around the world.
