

How I Calculate VTS Portfolio Performance
Apr 20, 2023
From time to time people email and ask how they can calculate month to month performance for their own trading. Now to be perfectly honest, I suspect this doesn't apply to that many of you in the community because most investors don't have any record of their trades and don't have much interest in going through that exercise. To each their own. Even though I find it valuable I understand I'm in a different position than most people where I'm also building and maintaining the strategies. Performance tracking is vital to me but may be less so for you so of course do what best suits you.
However, for those of you interested, I can help answer the question by showing how I calculate the official performance for the Total Portfolio Solution.
VTS Total Portfolio Solution performance tracking assumptions:
1) I track official performance using the live trading track record of a 25,000$ portfolio size. Many of you will be trading larger accounts, but I want to make sure that the entire portfolio including all the Options spreads can be traded on a small amount for those who are just starting their investing journey. It can actually be done on accounts even smaller than that, probably closer to 10,000$ is enough, but I feel 25,000$ is a good number to track officially.
2) The VTS Total Portfolio Solution is currently made up of 5 strategies and each have a 20% allocation. Based on the official 25,000$ portfolio this means each individual strategy receives a 5,000$ allocation per trade.
3) All performance for the main ETF strategies (Defensive, Strategic, Balanced) are recorded and marked at the end of each month, even if trades are left open through to the next month. I use the official closing prices of the ETF for the end of month mark, and use the same end of month closing to mark the beginning price for the next month.
4) For Options trades (Volatility Trend and Iron Condors) I record performance based on the trades that were closed during that month. Due to the nature of options decay, I don't mark those prices to the end of the month. I only record performance of Options trades for the ones that were officially closed and realized in that month to make things easy.
5) Performance in the three ETF strategies (Defensive, Strategic, Balanced) are marked using the entry and exit prices of each trade. This is easily doable because ETFs scale very efficiently to account sizes of 25,000$ or higher.
6) Options performance is calculated by rounding down to the nearest full contract and calculating the performance based on the size of the trade. This is to make sure that anybody using the Options strategies are seeing the performance of what they would actually get following the strategies in real time. Contract size matters with Options, but it's far less so with ETFs.
7) Trade fees are no longer included in the ETF transactions for the three tactical strategies (Defensive, Strategic, Balanced). From 2012 through 2021 I was including a 5$ trade fee, but the race to zero commissions means there's many brokers that don't charge ETF fees anymore. The last 2 years I have stopped including trade fees for ETFs.
8) Options trades (Iron Condors and Butterflies) still include trade fees calculated based on 0.65$ per contract. There are many cheaper brokers but 0.65$ is what TOS is. That means 1 contract of an Iron Condor will cost 2.60$ to open (4 legs x 0.65$) and 2.60$ to close. Butterflies are the same, it's 3 legs but the inner short strike is double the contracts which means it's also 2.60$ to open and 2.60$ to close per contract.
Example #1: March 2023 performance - Tactical Balanced strategy
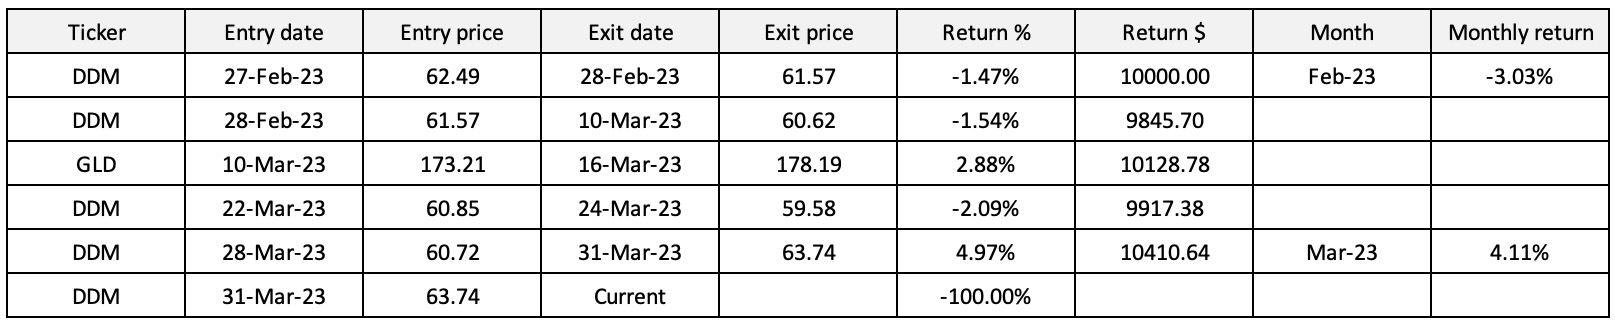
- The first line shows the DDM trade that was opened on February 27th, 2023. Even though this trade wasn't officially closed until March 10th, notice how I marked the performance as if the trade was closed on February 28th? That exit price of 61.57 is the official closing price of DDM on the last day of February. It needs to be marked so I can record February performance, which for that strategy was - 3.03%.
- In line 2, I then use the same price of 61.57 as the opening price for the March cycle with that DDM trade that carried over. All trades closed in March are recorded there in the table with the entry and exit.
- The 2nd last line shows the trade being closed on March 31st, 2023. I'm using a closing mark of 63.74 which was the closing price of DDM at the end of March. Note, this trade wasn't actually closed on that day, but I have to mark the trade to the end of month again so I can record the March performance which was + 4.11%
- Then the last line shows April begins with that same DDM trade and the same closing price from the previous day. Now the cycle will start again in April and even if we have a trade open at the end of April, I will mark it to the monthly close and get the official results for April.
Rinse repeat for all strategies every month...
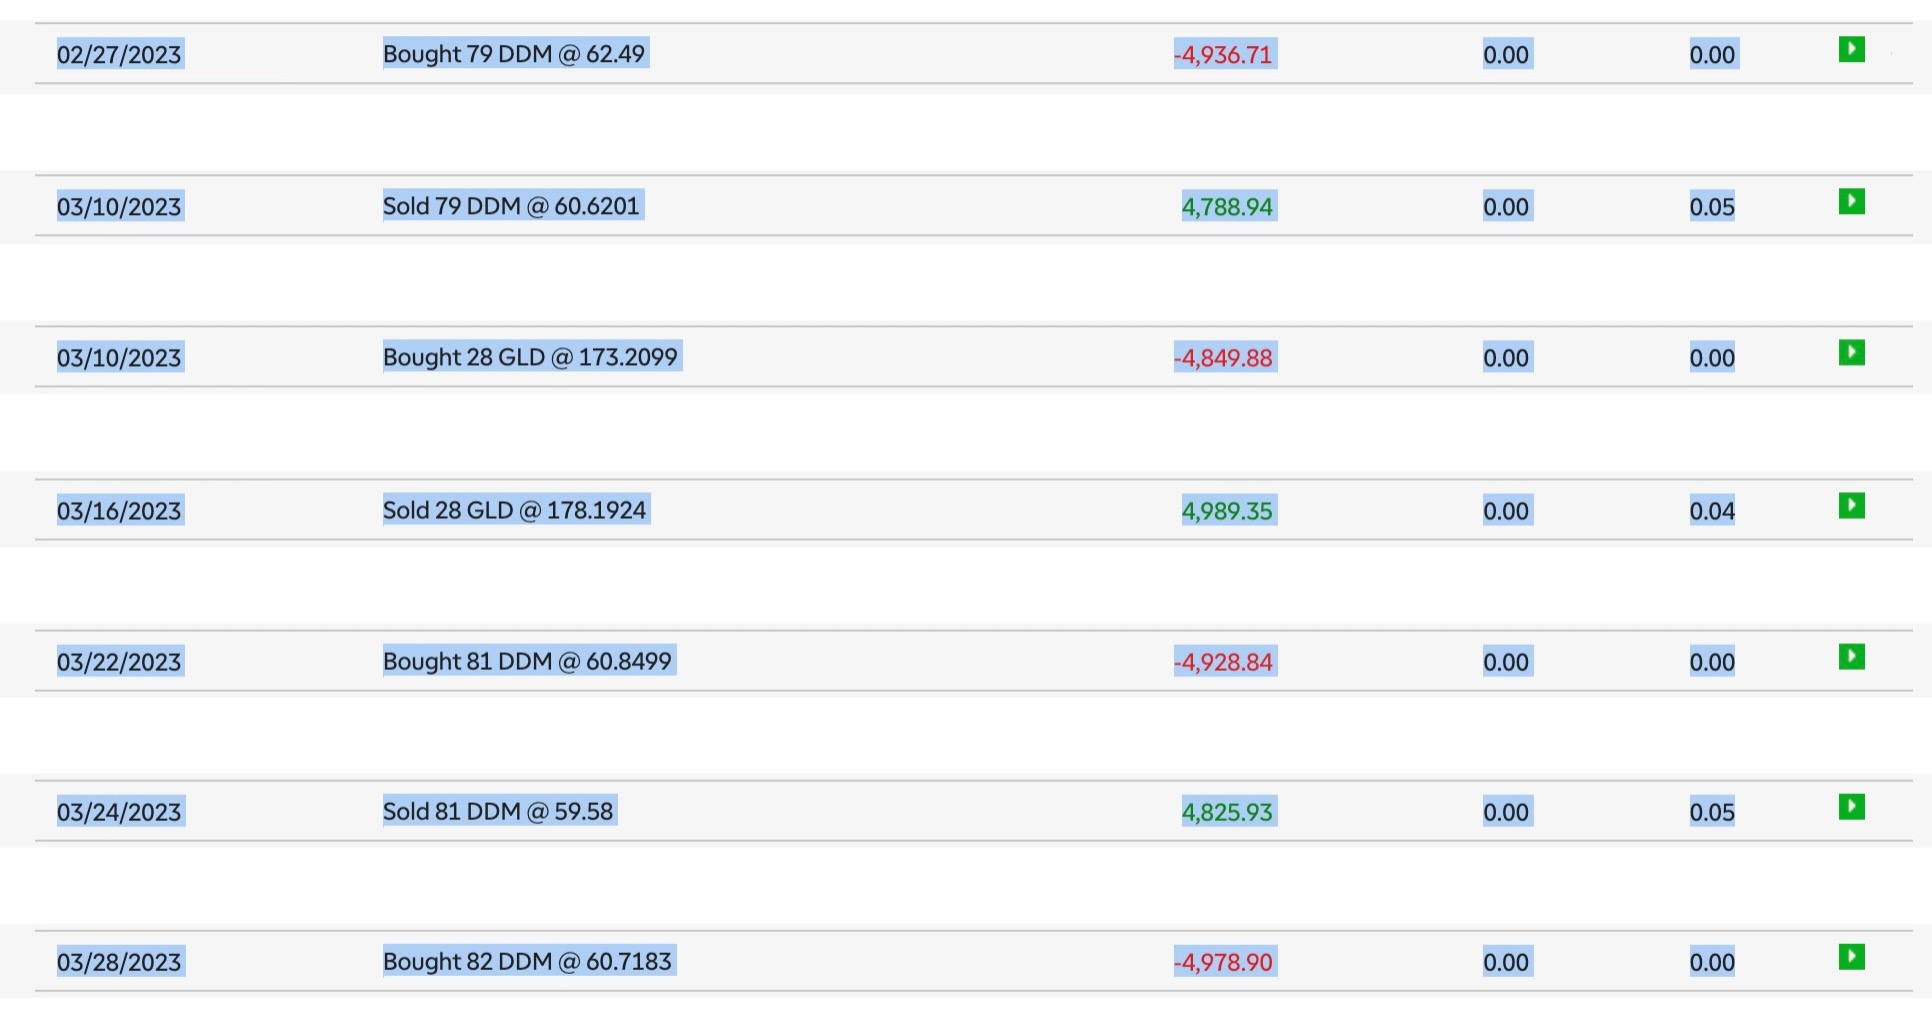
Remember I said the track record is based on live trades of a 25,000$ model portfolio, so here are those live fill prices for those trades in the order they were taken. Again, you don't have to do this with your own trading, but obviously if people are following my performance it's important to take some extra time and account for it accurately.
Subscribe to my YouTube channel here
Example #2: March 2023 performance - Iron Condor Strategy
Remember, for the Iron Condor Strategy and the Volatility Trend Strategy, because they are Option spreads it's more accurate to just record the performance based on official trades that were closed during that month.
In March 2023 we only had 1 Iron Condor that officially closed. Here is the full trade from the spreadsheet that you downloaded in Lesson #4 of the Iron Condor Course
It's hard to show because it's a line across, so I've divided it up into 6 shorter rows. Hopefully it makes sense, that it reads left to right, top to bottom :)
* The only important performance numbers are colored

Blue - Trade was opened for 1.32 credit
Red - Trade was closed for 0.70 debit
Yellow - Trade fees were 10.40 to open and close (0.65$ per contract)
Green - 113.60$ profit after trade fees for 2 contracts
Green - 113.60 / 5,000$ strategy allocation = 2.27% in March 2023
Calculating performance is tedious but not difficult. As I said for me it's 100% mandatory of course. I'm presenting my portfolio as a potential for people to follow, and getting an accurate gauge of expected performance is extremely important.
Now I don't have a crystal ball as far as predicting my future performance, but I'm confident that whatever the market throws at us going forward I will be able to successfully navigate it.
As Alex Hormozi says:
"You don't become confident by shouting affirmations in the mirror, but by having a stack of undeniable proof that you are who you say you are."
I have 17 years of experience that tells me that while I also at times feel uneasy about the future, I know I have a stack of undeniable proof that I absolutely know what I'm doing and I've got this!
.
Take Control of your Financial Future!
Profitable strategies, professional risk management, and a fantastic community atmosphere of traders from around the world.
