

Volatility Metric - VIX9D:VIX ratio (fast crossover)
Jun 05, 2019VTS Community,
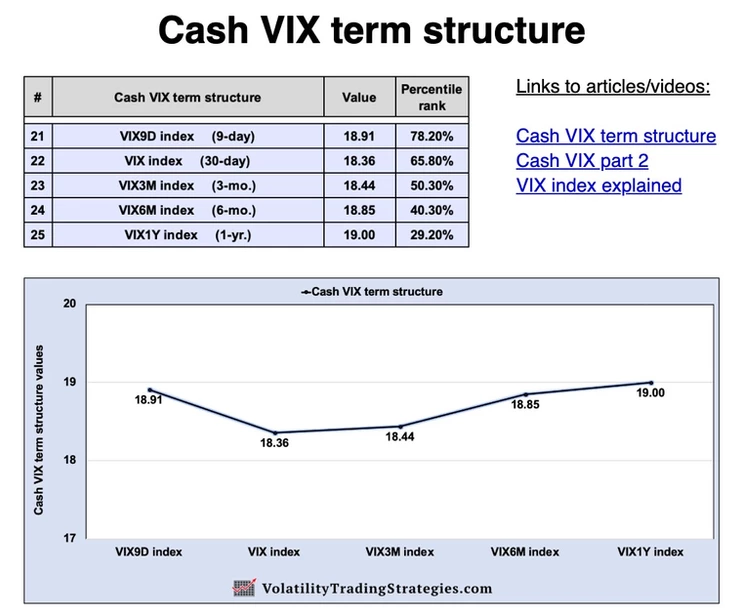
Even if you're relatively new to the VTS community, it doesn't take very long following my daily blogs before you're introduced to the cash VIX term structure. More specifically, these are the 5 cash volatility indexes:
VIX9D: 9-day forward implied volatility VIX: 30-day forward implied volatility VIX3M: 3-month forward implied volatility VIX6M: 6-month forward implied volatility VIX1Y: 1-year forward implied volatility
As you may know, you can't directly own the VIX index. It's just a statistic, calculated based off a strip of S&P 500 options. This is why it's often referred to as the "cash" VIX. The VIX9D, VIX3M, VIX6M, and VIX1Y are just like the VIX, just over different time periods. They are also just statistical values based off S&P 500 options, which is why I call it the "cash" VIX term structure. Investors can't directly own any of these, but that doesn't mean they aren't extremely important.
I post the raw values of all 5 of them in every daily blog, their percentile ranking compared to all previous values, and I also show them plotted on a curve as well which looks like this:
And, if you want to set aside some time for some light reading over the weekend, I've written articles specific to the cash VIX term structure here and here.
Why do I talk about this so much?
Those 5 data points are absolutely packed with useful volatility information. The shape of the curve, the magnitude of each value, percentile rankings in relation to past periods, the differences between durations, their moving averages and momentum over time, where they are in relation to different expiration VIX futures, there's a wealth of information packed into the cash VIX term structure. Today I'll unpack just one of them, but again I'm not overstating it when I say there are dozens of useful ways to interpret those data points.
VIX9D:VIX ratio (fast crossover)
First I'll show how to calculate it because that's easy enough, and then after that we'll talk about what it means. So as an example, let's use values from May 31, 2019:
VIX9D on May 31, 2019: 19.00 VIX on May 31, 2019: 18.71
VIX9D:VIX ratio (fast crossover) = (VIX9D / VIX)
(19.00 / 18.71 ) = 1.0155
So this metric is just a ratio of the VIX9D value compared to the VIX index. If it's below 1 it means the VIX9D is trading below the VIX. If it's above 1 it means the VIX9D is trading above the VIX.
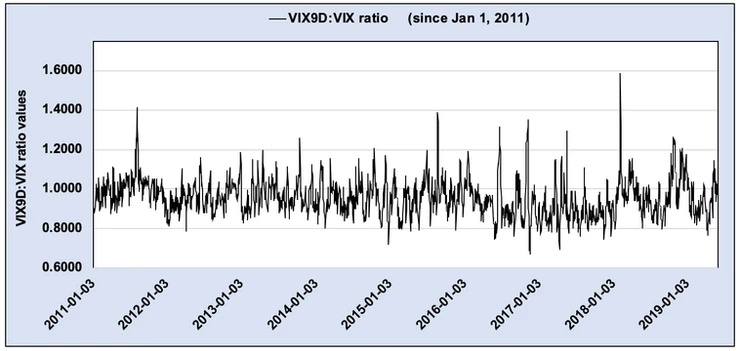
VIX9D:VIX ratio since Jan 1, 2011:
And some basic statistics at a glance:
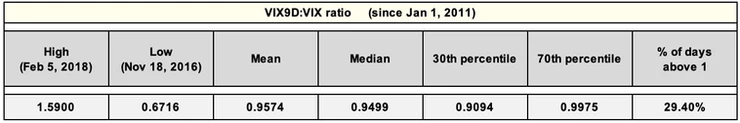
So in the last 8 years the VIX9D:VIX ratio doesn't often get below 0.80 or above 1.20, that's generally it's range. But why is this ratio even important?
Simple to exponential moving average analogy:
One of the most common tools that traders use in their technical analysis of the markets is a simple moving average (SMA). It's just an arithmetic moving average, calculated by adding up the values and dividing by the number of occurrences. So a 10-day simple moving average of the S&P 500 for example is just the most recent 10 days of prices divided by 10.
Another very common tool is an exponential moving average (EMA) which gives more weighting in the calculation to more recent occurrences. This makes the exponential moving average a faster reacting one than a simple moving average.
So how can these two moving averages be used together? Well, if the exponential moving average reacts faster to recent data points, can you see why it would be useful to track the exponential moving average vs the simple moving average in a crossover signal?
If EMA > SMA it means the underlying is on the move right?
VIX9D:VIX ratio is very similar:
The VIX9D is a 9-day statistical measurement, where as the VIX is a 30-day measurement. This means the VIX9D reacts much quicker to movements in the underlying compared to the VIX. So just like with the exponential vs simple moving average analogy, tracking a VIX9D:VIX ratio and using it as a crossover signal can be telling.
-
If VIX9D > VIX, all other things being equal it may mean volatility is moving higher recently.
-
If VIX9D < VIX, all other things being equal it may mean volatility is more stable recently.
This is why I call it the "fast crossover" signal, because the VIX9D reacts very quickly to movements in the underlying S&P 500 options market. It doesn't take much to see it cross over the VIX.
Recent example of VIX9D > VIX crossover:
Here's a chart showing both the VIX and VIX9D in the last two months, April and May of 2019:
VIX9D & VIX from Apr 1, 2019 - Jun 4, 2019:
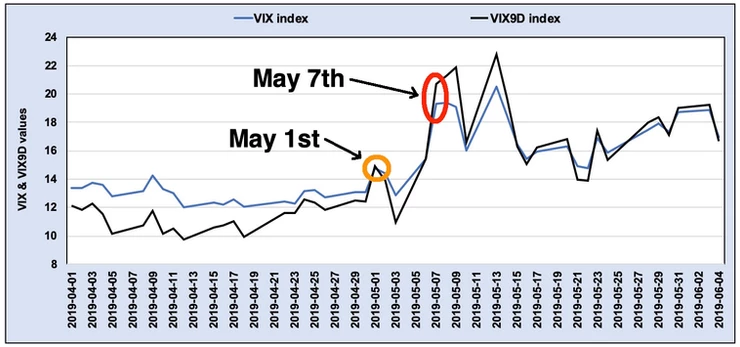
The VIX9D went slightly above the VIX on May 1st, and went substantially above it on May 7th. Clearly volatility was on the move in the first week of May 2019.
Now let's take a look at the S&P 500 over the same two month period, and I'll plot those two dates on the chart:
SPX (S&P 500) from Apr 1, 2019 through Jun 4, 2019:
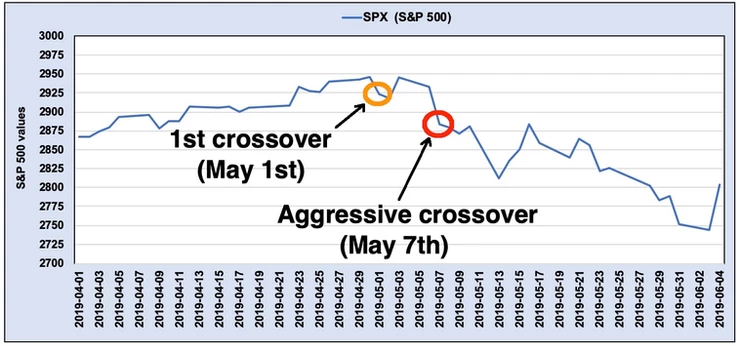
Depending on how this signal was used, you can see there may have been some substantial S&P 500 downside avoided if a trader exited at a certain VIX9D:VIX crossover threshold.
Conclusion:
I present this signal as an additional tool you can add to your trading toolbox. Its absolute value and percentile ranking of previous values is displayed in the Volatility Dashboard every morning in my blog. Now keep in mind there's no right or wrong way to use it, so get creative and think about ways it can apply to your own strategies. There are ways to view it as a trend following signal to help determine when it's time to move to safety. There are also ways to use it as a contrarian signal for potential opportunities to fade a short term volatility spike.
By very design and methodology, the VIX9D reacts to market movements faster than the VIX index does. Use this information in the best way you know how :)
Take Control of your Financial Future!
Profitable strategies, professional risk management, and a fantastic community atmosphere of traders from around the world.
