

VTS Volatility Trend Strategy crushed it in 2022 (Short Volatility)
Jan 01, 2023VTS Community,
With 2022 in the books, we can discuss results from our VTS Volatility Trend Strategy. As I mentioned last week, it's the strategy in our portfolio that overwhelmingly gets the most questions asked. I would imagine that's partly due to people not having experience with Volatility ETF trading or Options trading, but a lot of it is also due to the great results we had this year compared to all other asset classes.
Before we get to those results, let me remind you all there is a full video explaining the strategy that I hope everyone can set aside 10 minutes and watch through.
It's a "Short Volatility" strategy with very little high side risk. A powerful addition to any diversified portfolio:
(click the image to view the video)
2022 was a great year for the VTS Volatility Trend Strategy
You can see the month to month performance chart down below and the final return for the year coming in at just over 10%. That's below average long term as the strategy is closer to 18% CAGR, but as we'll get into in a minute, the S&P 500 was down big last year so I consider this a success all things considered.
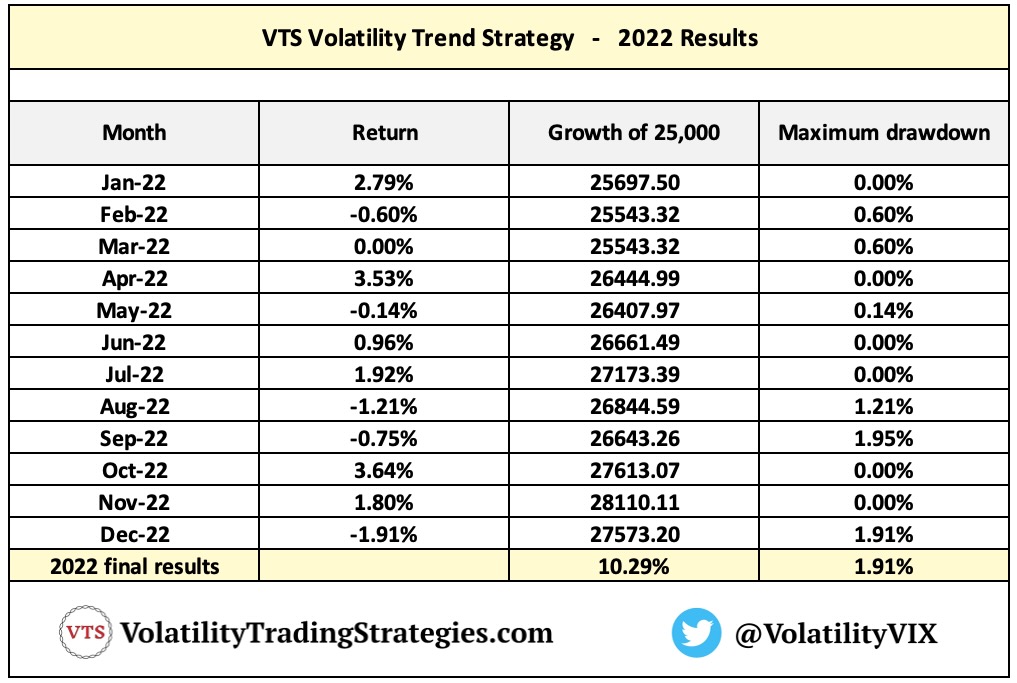
Great return with nearly no drawdown
A ~10% return for the strategy in a year where all major asset classes were down significantly is obviously a victory and helped our portfolio a lot. After all, we do have 3 strategies with 20% allocations each (Defensive, Strategic, Balanced) that do use all those asset classes that were down. We also needed an Alpha boosting strategy in a bad year and Volatility Trend did exactly that.
However, the stat I am most proud of is the strategy only suffered a maximum monthly drawdown of less than 2%. Basically, smooth sailing the entire year through all manner of different market conditions. The overall market had fast crashes, quick recoveries, strong reversals, volatility spikes, volatility Crush, and everything in-between. Yet the Volatility Trend Strategy was perfectly stable.
For comparison, the standard "Buy & Hold" diversified portfolio many people compare to is comprised of a mix of stocks bonds and gold depending on the investors risk tolerance. Here's how they each performed year to date in 2022.
S&P 500 (SPY) return: -19.4%
S&P 500 maximum drawdown: 27.5%
20+ yr Treasury (TLT) return: -31.1%
20+ yr Treasury maximum drawdown: 38.1%
Gold (GLD) return: -2.6%
Gold maximum drawdown: 22.1%
Aside from the odd portfolio rebalance here and there, the vast majority of the investment world are essentially buy and hold investors. 2022 has obviously been a terrible year for institutional asset managers, financial advisors, pension funds etc that are very heavily skewed to something resembling a 50/30/20 or 50/40/10 portfolio.
2022 will go down as one of the worst investing years in history.
Yes, I'm including the 2008 financial crisis and the dotcom bust in that statement. 2022 was worse from a diversified portfolio perspective.
* watch this livestream here if you don't believe me
Only three trades in danger of larger losses...
I record monthly performance based on all the trades that were officially closed out in that month. However, because we try to layer multiple trades at the same time we do often have more than one trade expire per month.
Here are the 20 individual trades in 2022 and their results:
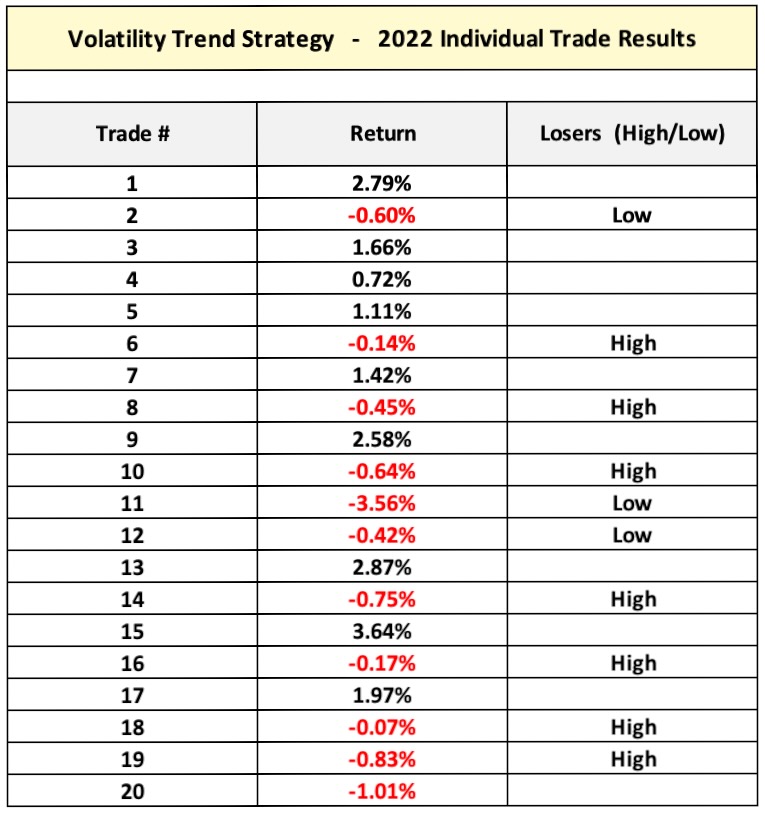
That last column labelled "Losers (High/Low)" refers to which side of the Butterfly Option our losing trades had the price expire on. It's important from a risk perspective to have a decent number of the losers expiring on the high side. That makes the strategy significantly safer long term because the maximum loss is much lower on the high side.
Remember the VTS Volatility Trend Strategy uses Broken Wing Butterflies (and sometimes regular Butterfly Options) to take a position on the major Volatility ETFs like VXX and UVXY that capitalize on the standard decay factor of those products. We want to set them up so the expected price drop of UVXY for example takes it right into our high profit range.
Here's an example from one of our trades in September:
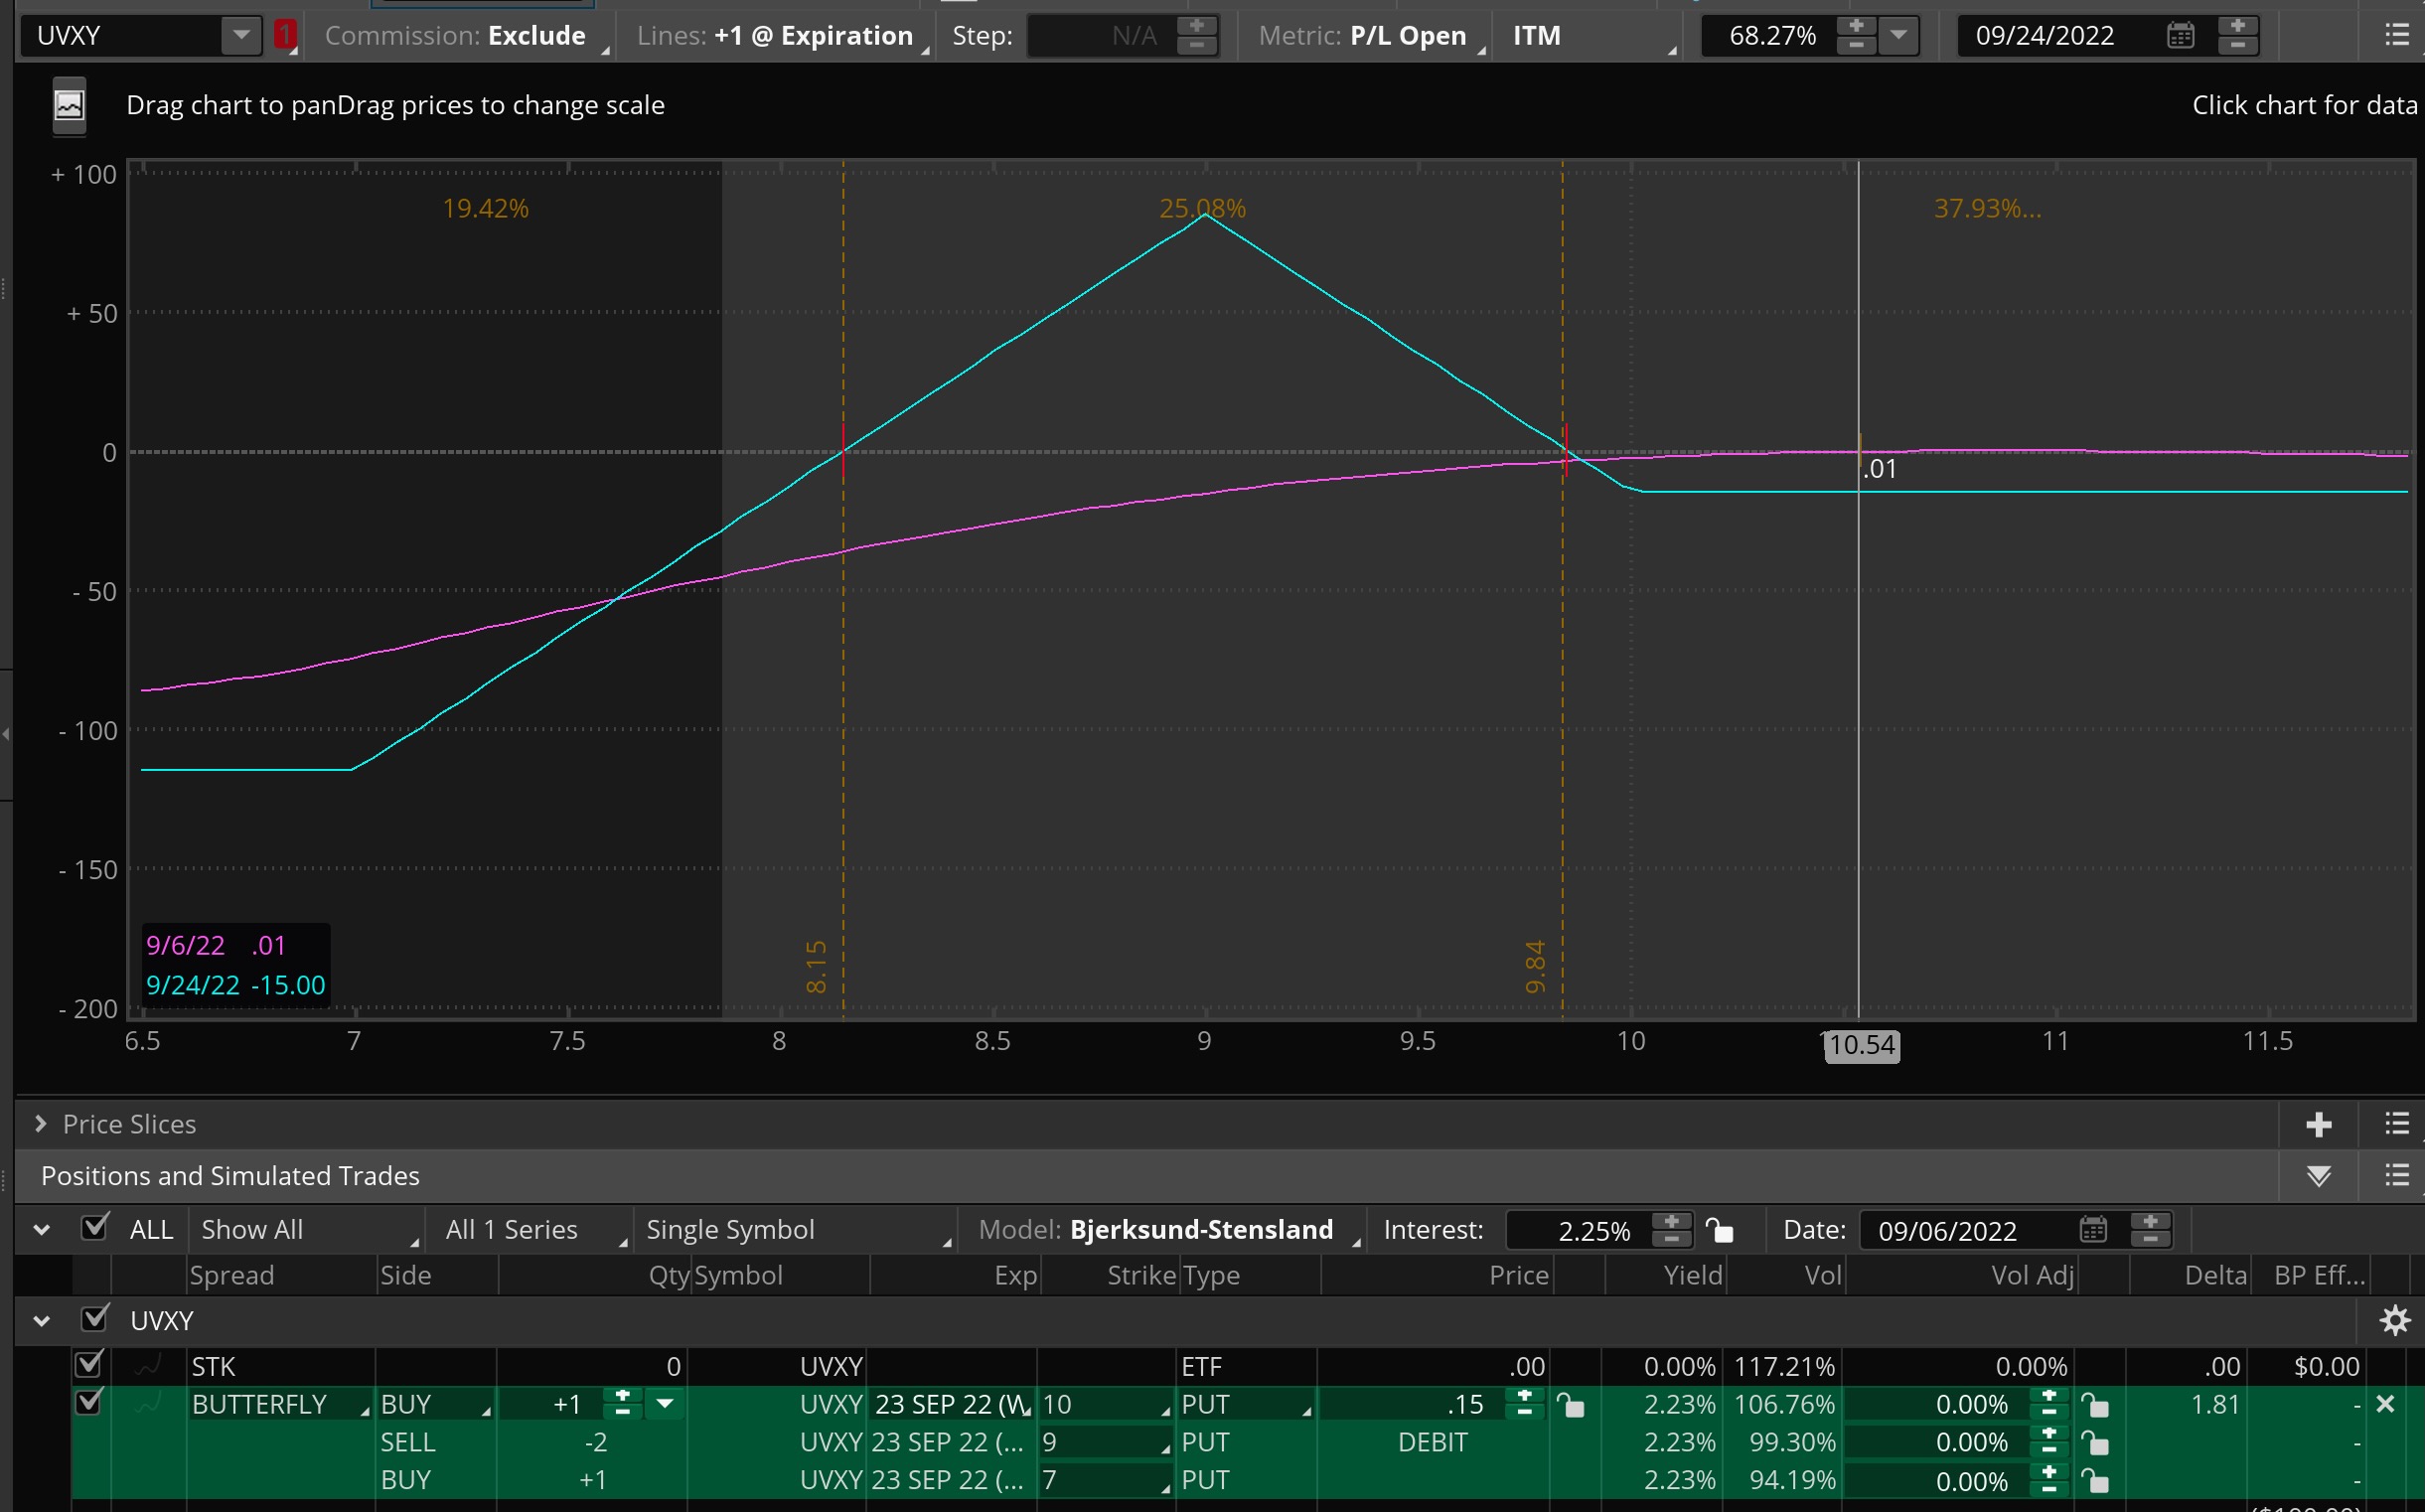
It was a 10 / 9 / 7 Broken Wing Butterfly with 2 weeks to expiration, opened when the UVXY was trading at 10.54, at a debit premium of 0.15$
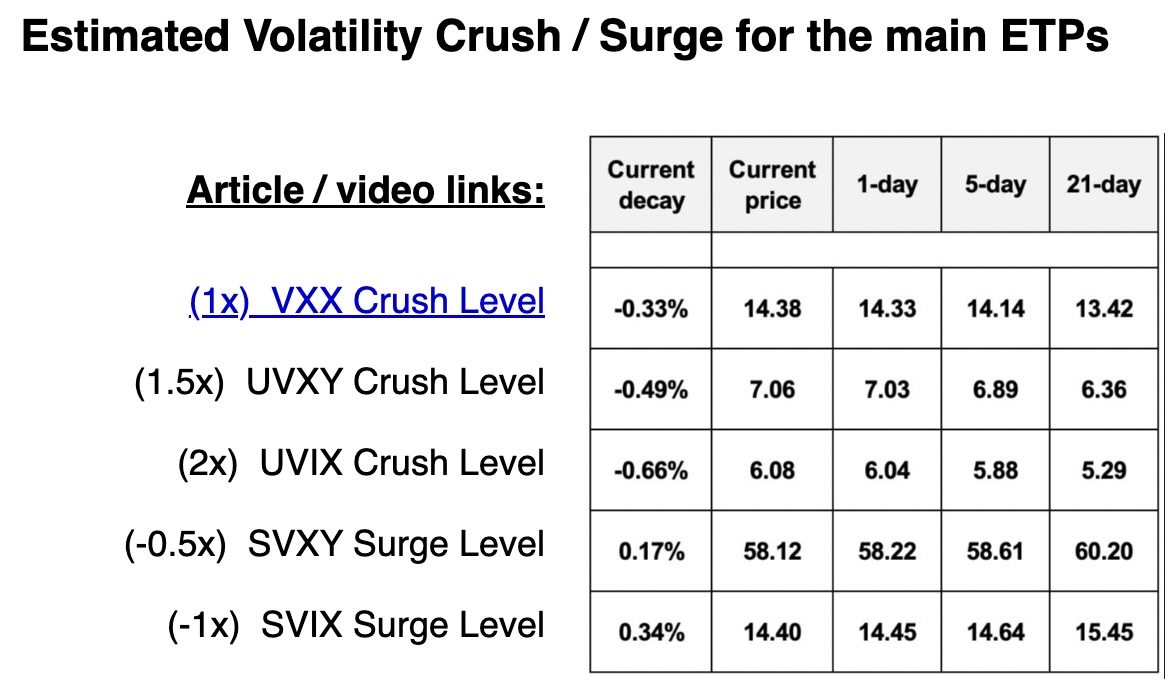
Based on the amount of VX30:VIX Roll Yield present at the time of opening the trade, coupled with other recent volatility data, we can make excellent predictions of how much potential decay is expected in the near term for all the various Volatility ETPs.
* Side note, I also post this estimated forward price data in every VTS Daily Trade Signals email in the Volatility Crush/Surge dashboard so if interested, you can Claim Your Free Trial to VTS and see what we're doing every day.
(this example below is from Dec 27, 2022)
That same September trade example with profit ranges labelled:
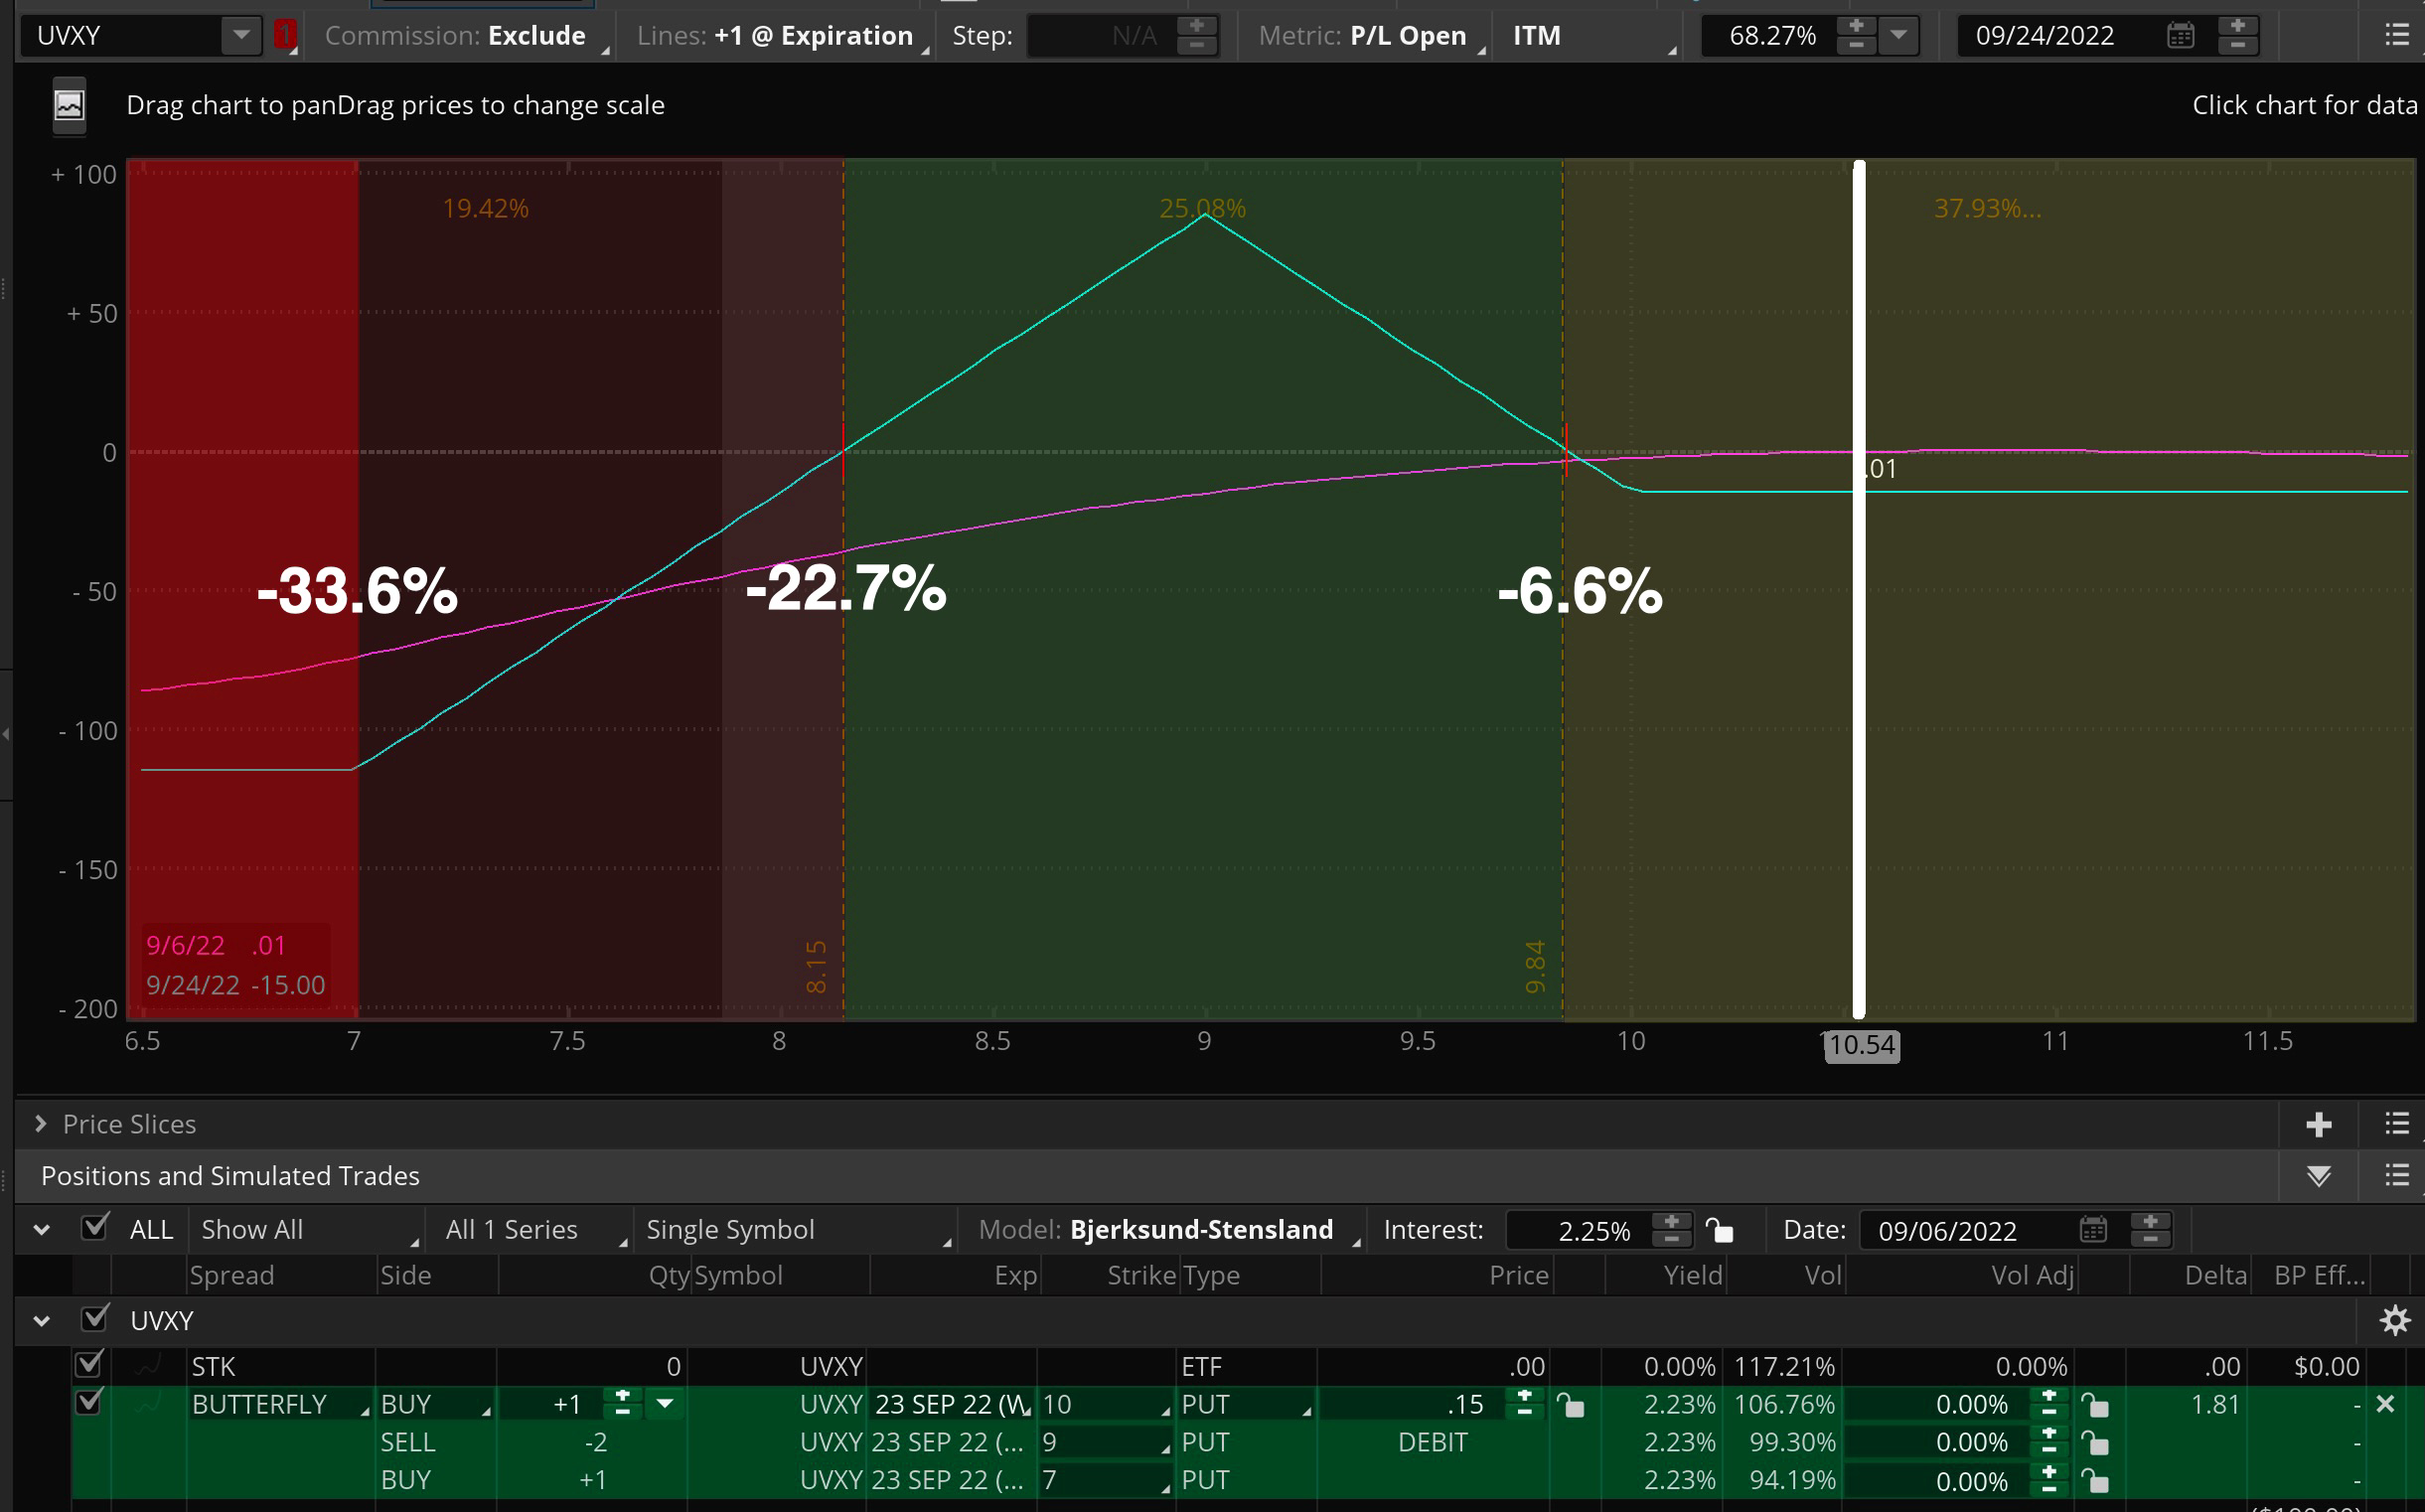
In that example from the September trade picture above we can see that a price drop of -6.6% would take the UVXY down into our profit range. That's a very common and realistic amount of decay when the VIX futures are in Contango and there is positive roll yield in the futures term structure.
This means VTS Volatility Trend is a "Short Volatility" strategy.
We profit if the UVXY decays. However, if the UVXY doesn't decay or it even goes up, we lose very little capital. The biggest risk by far in nearly all short volatility strategies is the possibility of major losses in the event of a volatility spike.
The old two steps forward and one GIANT step back pattern that is all too common in the Volatility Trading space.
For us though that's not an issue. In that example we would only lose 15$ per contract regardless of how big the volatility spike is.
The maximum loss occurs only if the UVXY decays -33.6%. While not impossible, this is extremely unlikely in a 2 week period. This is why we want most of our losing trades to be because the UVXY traded above our profit range (high) rather than below our profit range (low) where the larger losses may happen.
* Our entry setups were great in 2022 with only three trades expiring below our profit range, and only one of them significantly below.
We will take more trades in 2023
For me the ideal trade frequency for the Volatility Trend Strategy is about 20-30 trades per year give or take. Now that doesn't mean it happens consistently on a schedule or anything. Depending on market conditions there may be times when we go a whole month without any trades, and then we go a month or two with trades almost every week. Of course we are only interested in taking the highest probability trades so we never force anything. I don't mind staying in cash and patiently waiting for the best setups.
As things turned out we were a little on the light end last year with 20 trades, we probably could have got a few more trades in. We'll see how things play out in 2023 but I suspect we'll be a little more active with this strategy.
And remember, VXX is now ready for trading again (article here) so we may take some trades there along with our usual target of UVXY.
Take Control of your Financial Future!
Profitable strategies, professional risk management, and a fantastic community atmosphere of traders from around the world.
