

Here's why Correlation to the S&P 500 is so important
Mar 26, 2020VTS Community,
Studies show the average investor only makes about a 3-4% rate of return in the long run. That number may surprise you, but I'll explain one of the major reasons why that number is so low in this article. 3-4% a year in the long run, and remember inflation eats away at that even further so the average investor really is left spinning their wheels.
Most of their retirement fund will be coming from savings alone, investment activity is not helping them very much.
To add to the problem, the personal savings rate in the US and other western countries has been declining for years. In the 70's and 80's it was averaging 12%. In the last 20 years though that personal savings rate down to just 6% for the average American.
Personal savings rate since 1965:
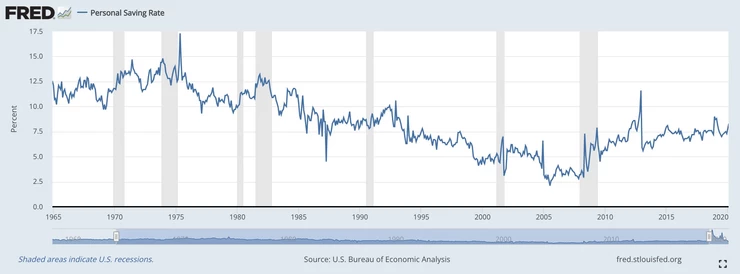
So what have we got? Low investing returns plus a steadily declining savings rate.
That combination in a nutshell is why you may be seeing a lot more articles in the last several years talking about the impending retirement crisis. It's real! That's not what this article is about so I'll just leave a link for an extended livestream we've done on the retirement crisis, it's worth checking out after this article:
Click here for the livestream: The coming retirement crisis (starts @ 6:10)
So why the low 3-4% rate of return for the average investor? Hasn't the S&P 500 returned much more than that in the last decade?
S&P 500 annualized return for the last 10 years:

Yes it has. Adjusting for inflation and including reinvested dividends along the way to maximize the growth, the S&P 500 has returned nearly 9% a year for the last decade.
However, it's been a 10 year long bull market so it's not really a meaningful comparison if you only include the best years. At some point we're going to enter a full on extended recession. Nobody knows when that will be of course, or how bad it's going to be, but at some point this bull market will end for an extended period of time.
So if we add 10 more years to that and count the last 20 years to include two bull markets and two bear markets, then the long-term annual rate of return is down to just 2.9% a year. That is much more in line with long-term expectations when including good years and bad years.
S&P 500 annualized return for the past 20 years:

And remember, we also know that 85% of asset managers (and by proxy most of their clients) underperform their benchmarks. With the S&P 500 being one of the best performing benchmarks in the world, what rate of return do you think the average investor gets in their overall portfolio when 85% of them can't even beat 2.9% a year in the long run? Well it's a very low number isn't it?
Why is this happening?
It's not just one thing, there's several contributing factors but one of the biggest reasons for the painfully low performance in the long run has to do with Correlation to the S&P 500.
The average recession cycle in the United States is roughly 6-7 years. Since most investors are highly correlated to the stock market, that means every 6-7 years on average they see their investment portfolio tank, maybe down 30-40% or more. In the last financial crisis the S&P 500 dropped -57% and took many years just to break even. Now of course most people don't hold their entire portfolio in stocks, but for many it is their largest allocation.
A long-term rate of return has to include those bad periods as well, and when we do that it quickly destroys a large portion of the gains that were made during the good periods.
Again nobody can predict the future, but at some point this party is going to end. Whatever performance investors have gained in the last 10 years, we can expect the majority of them to give back a good chunk of that, and probably a little beyond the index average simply due to additional emotional mistakes being made in the panic.
A long term rate of return includes both bull markets and bear markets. Both good times, and crashes. Since most investors are highly correlated to the stock market, they regularly see their portfolio rise and fall with the business cycle.
They're happy, then it crashes. They build it back up, then it falls again. Over and over, every 6-7 years on average, and they can't get off the hamster wheel.
Solution: Focus on lower correlation strategies.
One of the best ways investors can avoid this vicious cycle is to allocate towards strategies that demonstrate lower correlation to the stock market.
Our 5 VTS strategies and their correlation to the S&P 500:
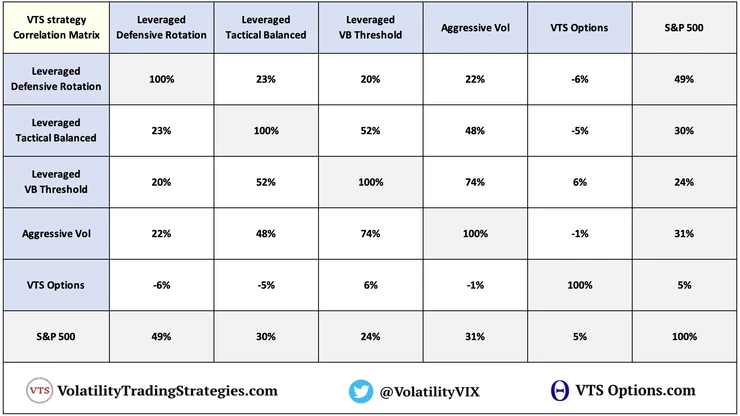
Given that it has been a 10+ year bull market, all 5 VTS strategies show a lower correlation to the S&P 500.
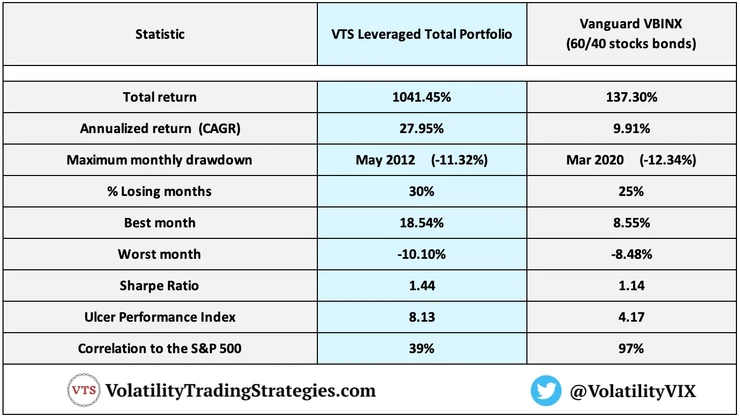
As a point of comparison, the Vanguard VBINX which is one of the most popular balanced index funds has a 97% correlation to the S&P 500. Hedge funds, and Hedge fund indexes like the HFRI are over 90% correlated to the S&P 500. The vast majority of asset managers and their clients are well over 90% correlated to equities. When stocks are up, investors are generally happy. When stocks crash, investors are feeling every bit of it.
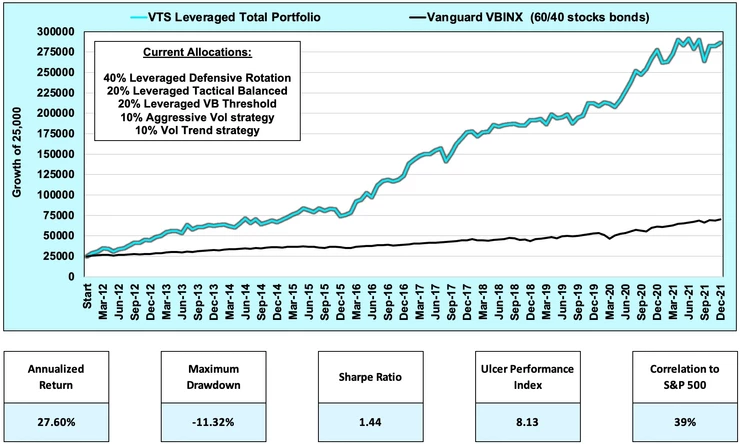
The fact that the VTS Total Portfolio is only 39% correlated to the S&P 500 is something I'm very proud of. It is extremely difficult to outperform the S&P 500 in a bull market while still maintaining such low correlation.
As I've talked about a lot in the past, most fund managers who outperform the S&P 500 (there aren't many) are typically just leveraged Beta to the S&P meaning better in good times and worse in bad times. We are not. The VTS Total Portfolio can also be considered a tail risk portfolio as every strategy we have has mechanisms in place to rotate into safety positions and capitalize on an extended recession when it comes.
Often times asset managers tell their clients they are "diversified" because their money is in several asset classes that sound different. Stocks, bonds, real estate, commodities, emerging markets, utilities, REITs, hedge funds, private equity, crypto, etc.
They all sound pretty different so combining them in a buy and hold portfolio should be good diversification right? Unfortunately, no. The mathematical correlation of many of those assets is quick high, especially in a market panic where correlations rise even further. We saw that this past month where I showed that in the panic, the inter-asset correlations rose substantially and most things went down together.
In a crisis, most investors realize very quickly how NON-diversified they really were.
VTS strategies all have lower mathematical correlations to each other, but most importantly, to the stock market which is one of the reasons I've managed to keep the maximum drawdown in the overall portfolio so low over such a long period of time.
Correlation to the S&P 500
Ignore this statistic at your own peril my friends. It is highly overlooked, but 10+ years into the longest bull market in history may be a good time to start paying attention.
Take Control of your Financial Future!
Profitable strategies, professional risk management, and a fantastic community atmosphere of traders from around the world.
