

What is an average VIX? - Mean reversion / Mode reversion
Dec 10, 2020VTS Community,
It's been a rough 2020 all around the world and we're not quite out of it just yet. Cases of Covid are still very high in many countries so we still need to be diligent and careful. However, we are starting see some light at the end of the tunnel. Medical outcomes of those who contract the virus are much improved, and we have several promising vaccines on the horizon. The world is on the mend!
Specific to the volatility markets, the VIX index is also on the mend and is threatening its first close under 20 since before all this mess started.
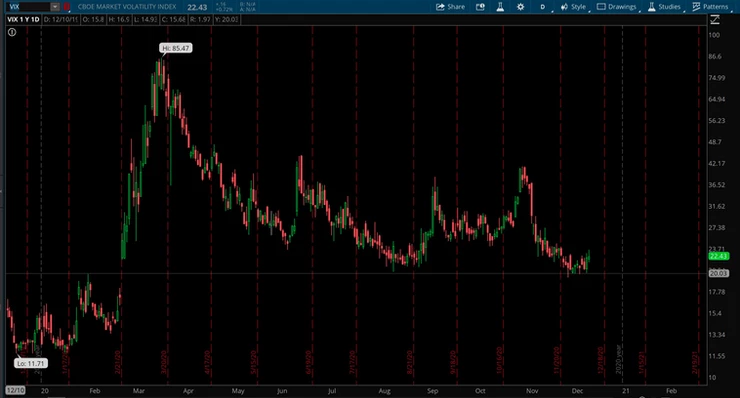
Make no mistake though, volatility is still very elevated right now. When I say that, and I have been in articles, videos, and on Twitter, inevitably I get people who say:
"But isn't the long term average VIX around 20?
Yes, that's true. We can see below that since 1990, the mean VIX value is 19.46
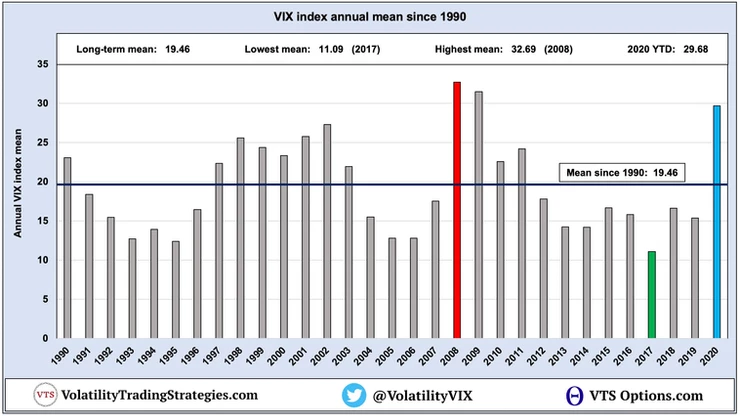
Now 2020 has obviously seen very elevated levels, currently ranking the 3rd highest in a calendar year since 1990, but still, we're near 20 now and that's very close to the long term average.
So why do I say it's still very elevated? It's because there are several ways to calculate and represent what's average.
1) Mean: The average of a set of numbers
To calculate the mean, it's just a straight average of a set of numbers. We add up all the values and divide by how many values there are. The problem with looking at an average on the VIX though is that it has closing values that range from 9.14 on November 3rd, 2017, all the way up to 82.69 on March 16th, 2020.
Those high end values over 50 really pull up the mean and give a very skewed view of what the true average really is. So we can definitely improve on the robustness of our measure beyond the mean. There's two much better ways to measure what the true average VIX is:
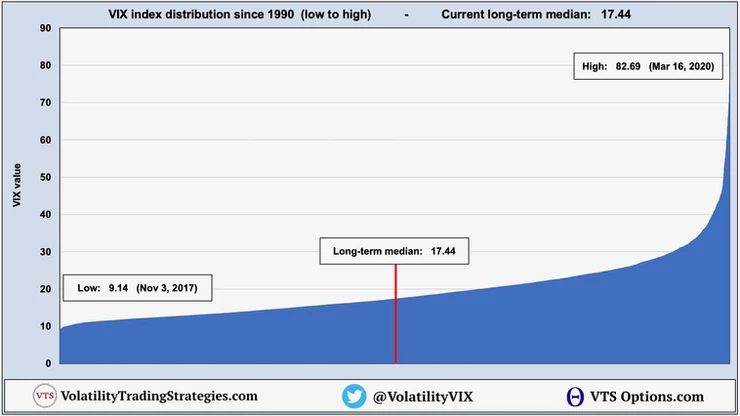
2) Median: The middle number in a set of numbers
To calculate the median, we just order a data set and find the actual middle number in the sequence. So as a quick example, if we have 5 values (3, 3, 4, 6, 9) the median would be the middle value of 4.
When dealing with the VIX and its very wide range of values, the median is a much better representation of the average than the mean. I'd rather know that 50% of all VIX values have been below 17.44, and 50% of all values have been above 17.44.
3) Mode: The value that occurs most frequently in a data set
To calculate the mode for the VIX, I prefer to do it in "handles." For example, if the VIX is 20.25, we call that a 20 handle. If it's 12.46, we say that's a VIX handle of 12.
Here's a chart showing all VIX handle's going back to 1990. Above 30 I grouped them in 5's because there are far less occurrences that high.
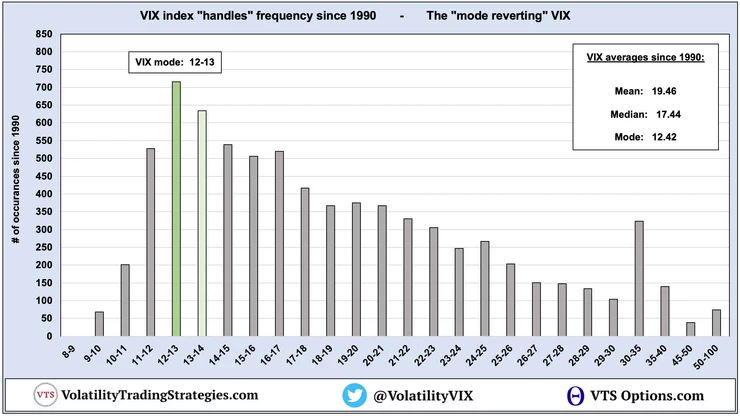
We can see the mode of the VIX is a 12 handle at 12.42, followed by the 13's, and then the 14's and 11's. This mode of 12.42 is probably the best measure of what the true "average" VIX really is, and I would say that's especially true for trading purposes.
- If you're the type of trader that's always expecting the VIX to "mean revert" to 20, you've likely burned through significant capital over the years hedging and trying to time volatility spikes.
- On the other hand, traders who expect the VIX and volatility markets in general to "mode revert" back closer to the 12's and 13's have a higher probably of riding equity trends higher, and finding clever ways of shorting volatility lower.
Warning: That last one, "shorting volatility" does require a lot of experience because it's not a trade you can just set and forget. It requires a really good understanding of position sizing and risk management and should only be taken on by those who know the risks and how to manage them.
Always keep in mind that the VIX index and the volatility complex in general is always seeking out lower values, that's the natural state of things.
-
The VIX futures spend the majority of their time in Contango.
-
The 9-day VIX9D index spends most of it's time below the 30-day VIX index
-
30-day implied volatility is normally well above 20-day realized volatility
-
And long Volatility ETPs like VXX and UVXY do spend most of their days bleeding downward
Just using that simple example from above: 3, 3, 4, 6, 9
Mean, the average is 5
Median, the middle number is 4
Mode, the most common number, is 3
While it's technically true that the average VIX is around 20, in a practical sense the other ways to measure average (median and mode) are far superior and give a much better sense of what the true average is.
With the VIX breaking below 20 for the first time in many months, I still say volatility in this market is elevated and potentially has a lot further to fall. That will of course depend on how the world handles the vaccinations, and whether we have any other surprises in store for us, but it's important to always remember that volatility seeks out lower levels. As a trader, this is valuable information to have within your overarching investing philosophy.
This video from 2017 covers it as well, but it was time for a refresh. That feels like another lifetime ago. 2017, the lowest volatility year in history. Given what 2020 was like, wouldn't it be nice to see a repeat of 2017 in 2021? One can dream...
Take Control of your Financial Future!
Profitable strategies, professional risk management, and a fantastic community atmosphere of traders from around the world.
