

VTS strategies have very low correlation to the S&P 500 - Recession ready?
Oct 17, 2019VTS Community,
Studies show the average investor only makes about a 3% rate of return in the long run. That number may surprise you but I'll explain one of the major reasons why that is in this article.
3% a year in the long run, and remember inflation eats away at that even further so the average investor really is left spinning their wheels. Most of their retirement fund will be coming from savings alone. Investment activity is not helping them very much.
To add to the problem, the personal savings rate in the US and other western countries has been declining for years. In the 60's, 70's, and 80's it was averaging 12%. In the last 20 years that personal savings rate is down to 6%. So what have we got? Low investing returns Steadily declining savings rate That combination in a nutshell is why you may be seeing a lot more articles in the last several years talking about the impending retirement crisis. It's real. That's not what this article is about so I'll circle back to that at another time, but why the low rate of return?
Why 3% a year on average in the long run? Hasn't the S&P 500 returned much more than that in the last decade?
Yes it has. In fact it's about 9% a year after adjusting for inflation in the last decade. However, it's been a 10 year long bull market and this is as good as it gets for the stock market. It's not really a meaningful comparison if you only include the best years. So if we add 10 more years to that and count the last 20 years, which then includes 2 bull markets and 2 bear markets, then the long term annual rate of return is down to just 2% a year after inflation, and only 4% a year when including all dividends being re-invested along the way. That is much more in line with long term expectations when including good years and bad years.

And remember, 85% of fund managers (and by proxy most investors) underperform their benchmarks. So what rate of return do you think the average investor gets in the stock market when 85% of them can't even beat 4% a year in the long run? Well, it's a very low number isn't it? Studies show, it's around 3% or less.
Why is this happening?
It's not just one thing, there's several contributing factors. But one of the biggest reasons for the painfully low performance in the long run is correlation to the S&P 500.
The average recession cycle in the United States is roughly 6-7 years. Since most investors are highly correlated to the stock market, that means every 6-7 years on average they see their investment portfolio tank, maybe down 30-40% or more. In the last financial crisis the S&P 500 dropped -57%. Now of course most people don't hold their entire portfolio in stocks, but for many it is their largest allocation.
A long term rate of return has to include those bad periods as well right? If we do, that very quickly destroys the gains that were made during bull markets.
Well, we're in year 10 of the longest bull market in history now. When this party ends, whatever performance investors have gained in the last 10 years, we can expect the vast majority of them to give up a good chunk of it, and probably a little beyond that simply due to additional mistakes being made in the panic.
A long term rate of return includes both bull markets and bear markets. Both good times, and crashes. Since most investors are highly correlated to the stock market, they regularly see their portfolio rise and fall with the business cycle.
They're happy, then it crashes. They build it back up, then it falls again. Over and over every 6-7 years on average, rinse repeat.
One of the best ways investors can actively try to avoid this vicious cycle is to seek out strategies that demonstrate low correlation to the stock market.
All 4 VTS strategies that make up the Total Portfolio Solution:
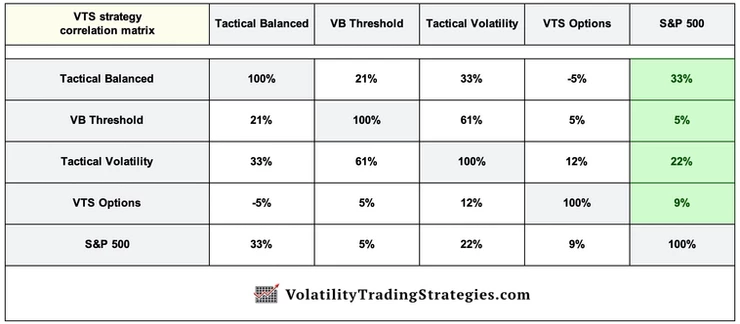
You can see that all 4 strategies have shown a very low correlation to the S&P 500 since inception. Anywhere from 5% to 33%, which in the context of a 10 year long bull market, that is very low. Remember, the Vanguard VBINX is at 97% correlation to the S&P and hedge funds are at around 90% correlation. The fact that VTS is around 20% is something I'm very proud of. And they also have low correlation to each other, which is why they all compliment the overall portfolio so well and add true diversification.
Often times fund managers try to tell their clients they are "diversified" because their money is in several asset classes that sound different.
Stocks, bonds, real estate, hedge funds, commodities, emerging markets, utilities, REITs, etc.
They all sound pretty different so combining them all should be good diversification right? Unfortunately no, the mathematical correlation of many of those assets is pretty high, especially in a market panic. In a crisis, most investors realize very quickly how NON diversified they really were.
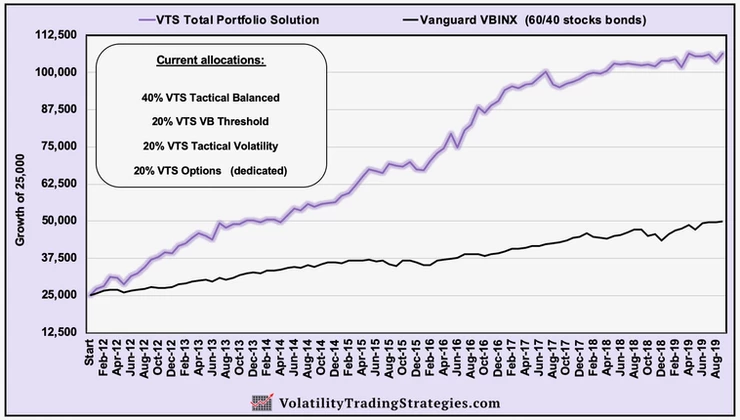
VTS strategies all show very low mathematical correlations to each other and importantly, to the stock market, which is one of the big reasons I've managed to keep my maximum drawdown in the overall portfolio to mid single digits. And just to highlight, the VTS Total Portfolio Solution was up about +2% in Q4 2018 when the S&P 500 was -20%. Of course the common disclaimer of past performance is not indicative... yadda yadda, but I have done well through every drawdown in the last 8 years and I'm ready for "the big one" when it finally comes.
Correlation to the S&P 500. Ignore this statistic at your own peril my friends. It's highly overlooked, but 10 years into the longest bull market in history, it may be time to start paying attention to it.
Educational video on Correlation:
Take Control of your Financial Future!
Profitable strategies, professional risk management, and a fantastic community atmosphere of traders from around the world.
