

VIX9D : VIX : VIX3M : VIX6M : VIX1Y - It may give early warning signs
Apr 12, 2019VTS Community,
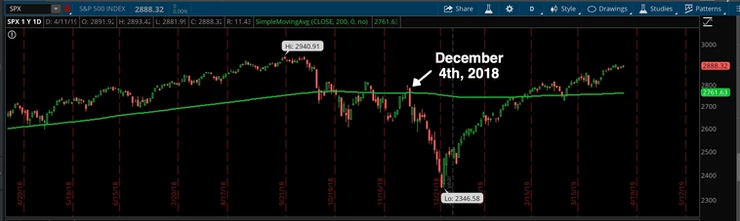
Let's take a quick trip down memory lane here to December 3rd and December 4th of 2018. Considering the carnage that was about to follow, I hope it isn't a bad trip down memory lane for you, sorry about that...
Anyway, up to that point the S&P 500 was down a little from the highs. Nothing crazy just yet, just what we would call a pull back or maybe a correction. You can see it highlighted in the below chart:
On Dec 3: M1:M2 VIX futures were 3.58% in contango
In early trading on Dec 4: M1:M2 VIX futures nearly hit 3.7% in contango
I remember that day well, because I was taken back by how many of the usual gang of "short volatility traders" on Twitter I saw piling back into trades, many of them claiming they are in "heavy." According to many of them, markets were oversold, the VIX futures were already comfortably back in contango, a clear green light to short vol right? Well it turned out it wasn't as the S&P began another violent leg down that day. Now it's easy to look back in hind sight and say we could have seen it coming.
A good chunk of what I do with the VTS community is teach people risk management, and how to use actual quantifiable signals to determine when to be in safety, and when it's ok to get back into trades. It's not 100%, it's based on balance of probabilities, but the record has been strong thus far. So why didn't my Tactical strategies move back into positions even though M1:M2 VIX futures were rising to 3.7%.
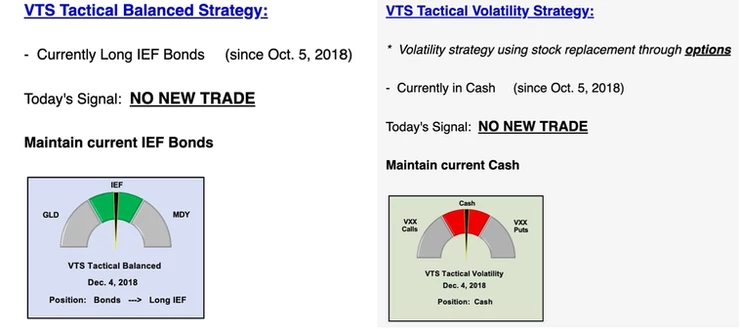
1) I did just keep holding my bonds and cash positions in both tactical strategies, which were initiated on October 5th, 2018 and lasted the rest of the year and into 2019.
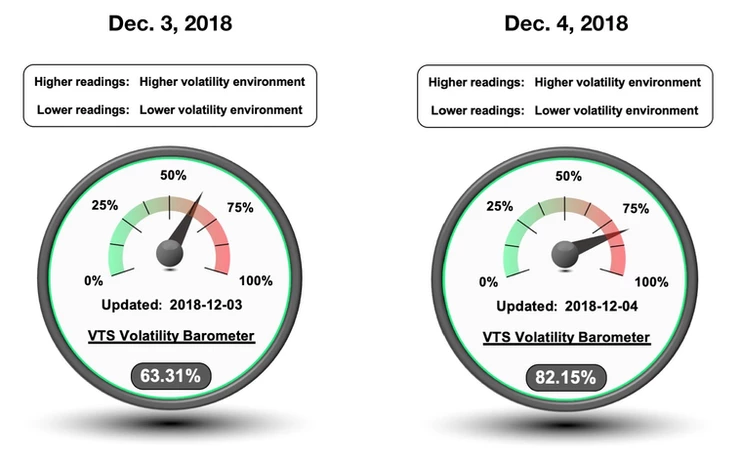
2) The VTS Volatility Barometer (full video explanation here) was at 63% on December 3rd signalling elevated volatility, and it was over 75% the morning of December 4th showing the potential danger on the horizon.
3) One of my favourite indicators was also giving a clear warning:
VIX9D : VIX : VIX3M : VIX6M : VIX1Y
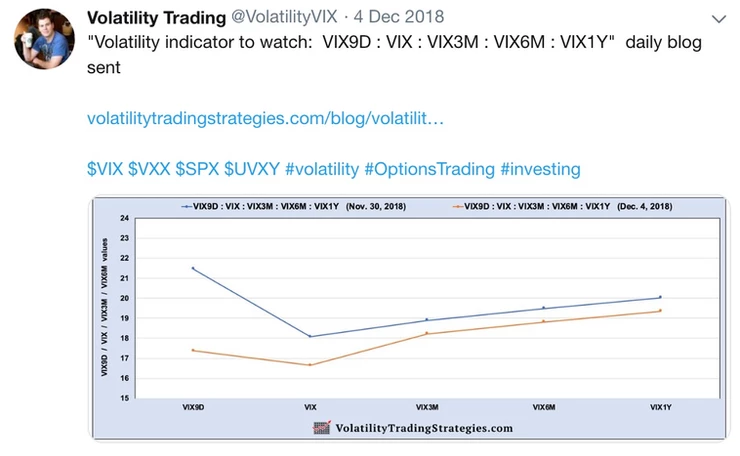
On Dec 3, 2018
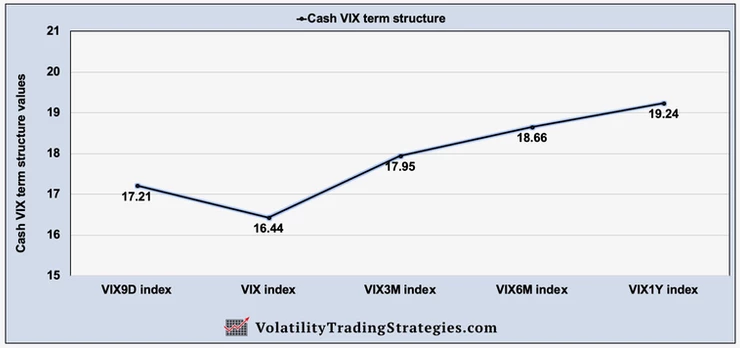
The slope. On Dec 3 the VIX9D (9-day) was actually above the VIX (30-day) which signals there is some short term worry in the market. Under normal conditions we'd see the VIX9D well below the VIX, and the rest of the time frame indicators upwards to the right. So even though the front two months of VIX futures were saying the danger is gone, the cash VIX term structure here is definitely not!
The magnitude. The gap between the VIX9D (17.21) and the 1 year VIX1Y (19.24) was very small, just 2 points. Again under normal conditions we'd see this gap quite large, sometimes 5-7 points.
For comparison, here is today Apr 12, 2019
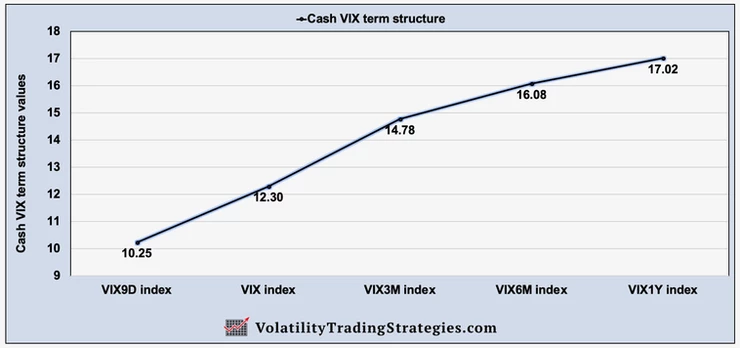
You see the difference? Right now the cash VIX term structure is completely normal. That doesn't mean markets can't start to deteriorate, that's always a possibility, but on balance right now markets are very calm. The slope is upwards to the right, and the magnitude or gap between the closest and furthest points is wide.
The Cash VIX term structure (VIX9D:VIX:VIX3M:VIX6M:VIX1Y) is in my opinion one of the most important volatility indicators to keep an eye on.
It quite often tips the markets hand a little sooner than individual indicators on their own such as the VIX by itself, or just the contango level of the M1:M2 futures.
I wrote an article on this very subject on Dec 3, 2018 and published it the morning of the 4th. Hopefully you follow me on Twitter and caught my warning. If not, it's never too late to start :)
@VolatilityVIX on Twitter:
That article is definitely worth reading if you want to learn more about this very important volatility indicator.
Take Control of your Financial Future!
Profitable strategies, professional risk management, and a fantastic community atmosphere of traders from around the world.
