

Volatility Metric: Simple VRP - Timing the market with VRP?
Sep 20, 2019VTS Community,
VTS Volatility Dashboard metric #14 - Simple VRP
* Note, I'm dividing this up into two metrics (Simple VRP and Traders VRP) and I'll keep both in the VTS Volatility Dashboard for a few months while people absorb the information. After I fill out the last metric in the dashboard I'll remove the Simple VRP and just keep the Traders VRP as it's much more useful. But I do feel the Simple VRP is a useful first step in understanding this very important concept. Whether you're trading volatility ETPs, options trading, or just tactical rotation of traditional asset classes, understanding the VRP is vital to finding an edge in your trading.
Defining the VRP:
VRP stands for Volatility Risk Premium, and it's a central concept that drives a lot of the pricing we see in financial markets. Before we specifically get into what the VRP is with respect to trading though, we can first view it through the lens of general insurance.
When you're buying insurance, whether that be car insurance to protect against damages, or fire insurance to protect your home, you're essentially paying a premium upfront to be protected against potential unknown events down the road. If an unfortunate event should occur, without insurance that cost may put you in serious financial jeopardy. You could lose your home, or your car, so it may be worth it to pay a small regular premium to eliminate that risk. The insurance company is willing to cover the cost of those events if they occur in the future, and they charge you money for that protection and peace of mind.
In this example, insurance buyers are paying premiums for protection and insurance companies are collecting the Volatility Risk Premium (VRP)
In trading it's the same. If an investor has a stock portfolio of mostly long positions, they could be in serious trouble if another financial crisis were to happen. They may feel it's worth it for them to hedge the portfolio against those potential loses. Buying options for example can put a floor price under the portfolio where no further losses can occur below that. However, that kind of risk mitigation isn't free, it requires a premium to be paid.
In this trading specific example, the option buyer is paying a premium for portfolio protection, and the option seller is collecting the Volatility Risk Premium (VRP)
So the Volatility Risk Premium is just a representation of the fact that the future is unknown. Many people have an emotional tendency towards risk aversion and there is a premium to be paid for that.
The VRP ebbs and flows with the perception of risk in the market, but long-term it will always be there. In essence it's the reason why most skilled options traders tend to play more on the short volatility side of the equation. Knowing that the markets have a natural tendency to overprice future unknown events, a skilled risk manager can use this to their advantage and profit from it. Essentially becoming the insurance company collecting the VRP, rather than the customer paying the VRP. Options selling is an attempt to capture the VRP.
Quantifying the VRP:
There's several ways to quantify the VRP with real data, but the easiest by far is captured in the very simple formula below:
VRP = VIX - SPX HV(20)
-
VIX is the actual value of the VIX index
-
SPX HV(20) is 20-day historical volatility of the S&P 500
- The VIX index is calculated from S&P 500 options and it's the markets expectation of 30-day forward looking volatility. It's not trading days, it's calendar days, so the VIX can be loosely viewed as one month forward implied volatility, or what market participants expect to happen over the next one month.
- Historical volatility, also called realized volatility, is a statistical measure of the dispersion of returns of an underlying security over a specific time period. It's a representation of variance from the mean. Since historical or realized volatility is based on trading days, and there are roughly 20 trading days in a month, SPX HV(20) can also be viewed as one month realized volatility, or what actually did happen over the previous one month.
This difference between what we expect to happen over the next one month (implied volatility) and what actually has happened over the previous one month (realized volatility) can loosely be defined as the Volatility Risk Premium.
Interpreting the VRP:
As I mentioned, in the long run there is a persistent Volatility Risk Premium present in the market, meaning that most of the time implied volatility is trading at a premium to realized volatility, ie VIX is trading above SPX HV(20). Traders need to be compensated for future unknown events, and the market naturally over prices them. But there are times when the market does make major moves and the premium is justified, just like there are times when we get in car accidents and our insurance is justified.
Simple VRP: VIX - SPX HV(20) since Jan 1, 2011
* There's no significance to that date other than it's the date my VTS Volatility Barometer data begins.
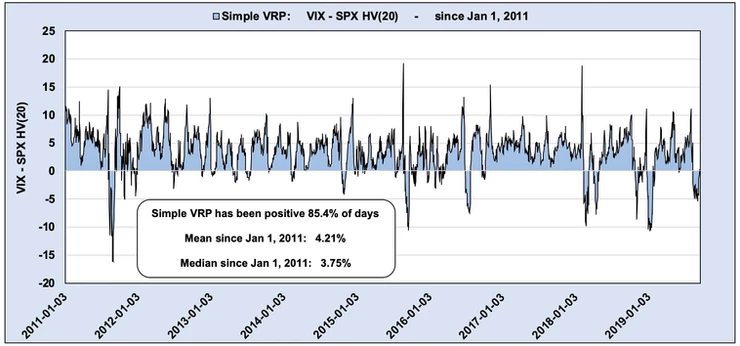
Since January 2011 the Volatility Risk Premium has been positive 85.4% of trading days, with an average VRP of 4.21%. It's persistently positive, but of course there are times when the market really is moving around a lot and the VRP is justified.
Practical application of the VRP:
So we know the Volatility Risk Premium is mostly positive but occasionally does go negative, so there's two questions we can ask here:
1) When does it typically go negative? 2) Can the Simple VRP signal be used in any actionable ways?
To answer the first question of when does the Volatility Risk Premium typically go negative, let's zoom in on just the most recent market action since it's fresh in our memories.
Simple VRP: VIX - SPX HV(20) since Jan 1, 2018
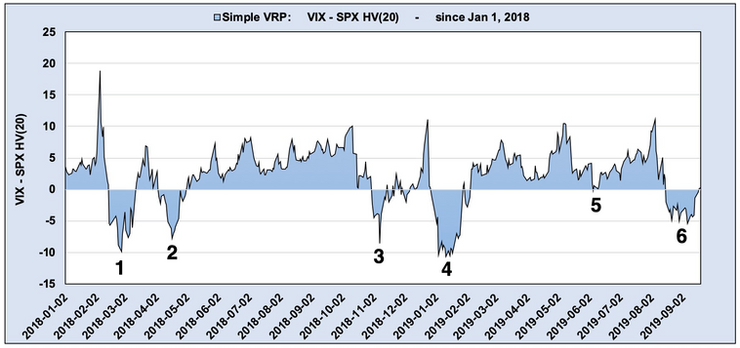
It's not a direct proxy, but if you look at the Simple VRP above since January 1st, 2018, we can see there have been 5 periods of persistent negative VRP and one other period where it nearly went negative but not quite, and those do align fairly accurately with periods of turmoil in the market.
1) February 2018 during the Volmageddon event. 2) March 2018 when the S&P 500 February lows were retested 3) October 2018 at the start of the Q4 decline 4) December 2018 when those lows were retested and breached 5) May 2019 when the S&P 500 was down -6.4% 6) August 2019 recently where we saw a -6% S&P 500 pullback
Negative VRP is definitely consistent with poor periods of S&P 500 performance so that answers the first question of when. As to the second question of whether there are actionable signals here, I would say yes.
This is a very broad generalization, and the "Traders VRP" which will be explained in my next article will be much more specific to this purpose, but in general:
- If the Simple VRP is high, it may be a period where shorting volatility, or going long the S&P 500, has a higher probability of success.
- If the Simple VRP is low, it may be a period where going long volatility, or shorting the S&P 500, has a higher probability of success.
Conclusion:
The Volatility Risk Premium is a key component to how risk assets are priced, and understanding it can give investors an edge when determining whether an instrument is fairly priced or not.
The difference between a positive and negative VRP can radically change the risk reward profile of a specific trade, so I always recommend investors not only conceptually understand the VRP, but also actively track it and use it as a potential filter for trade selection. Note, the "Traders VRP" coming soon is an even better volatility metric.
Now within the VTS Community it's not necessary for you to track it since I do that every day and post the current value as well as the current percentile ranking in the VTS Volatility Dashboard.
However, if you want to be more active and get into the habit of viewing the VRP you can add two studies in your trading software:
1) SPX IV(30) 2) SPX HV(20)
Here's how I have my charts set up in ThinkorSwim:
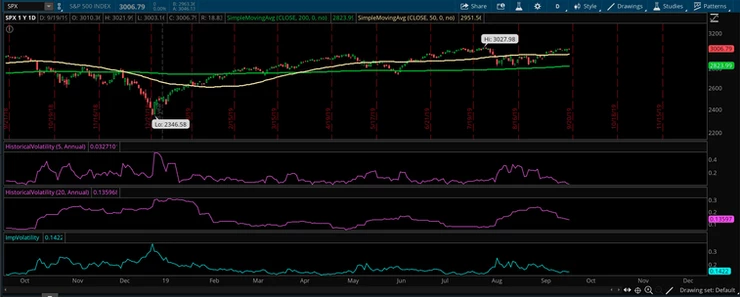
The turquoise study at the bottom is implied volatility, and the pink study just above that is HV(20). You can see above that I also have HV(5) which is the one I use for the "Traders VRP" coming soon, but if you want you can set up your charts to have these studies so it's easy to see the Simple VRP at a glance.
It's just one metric of many that I track, but it is an important piece of the volatility complex and definitely gives those who understand it an edge in trading.
Take Control of your Financial Future!
Profitable strategies, professional risk management, and a fantastic community atmosphere of traders from around the world.
