

Short Volatility (short VXX) performance within different volatility ranges
Aug 20, 2020Continuing on with the theme for the week, which is all about the VB Threshold strategy and its leveraged alternative, I want to discuss 2 topics today:
1) Trade frequency within each 20% quintile range of the strategy
2) Short volatility performance within each 20% quintile range
So if you've missed a few of the blogs, you can check out the strategy videos for both of them at the following links:
Trade frequency:
As you know, both the VB Threshold strategy and the Leveraged VB Threshold strategy both operate the exact same way. They divide the Volatility Barometer readings into 20% sections, and then depending on where the daily value is, we hold a specific ETF that performs best during that range.
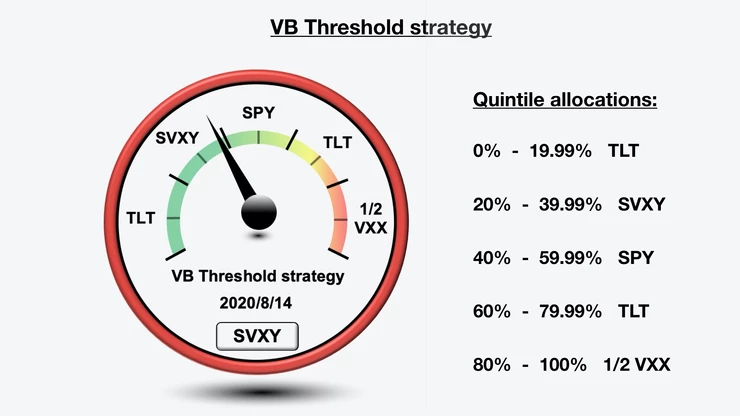
So it appears based on that breakdown that these are equal 20% sections right? However, as far as trade frequency distribution goes they aren't. In fact, as you can see below, the 20 - 40% section gets a lot more action than the other ones.
Percent of days for the 20% Volatility Barometer sections:
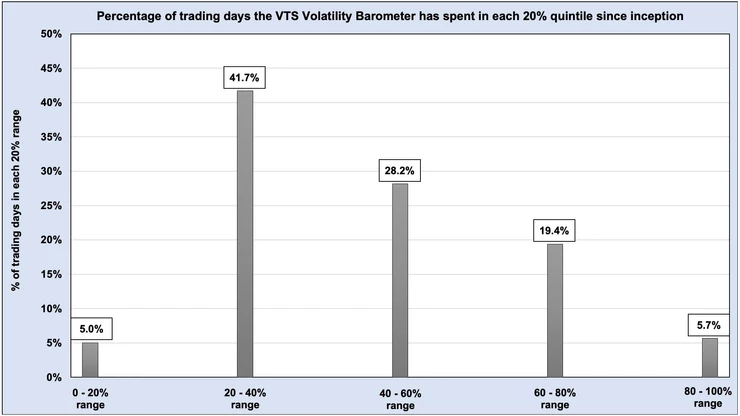
So even though I have divided it into 5 sections with 20% each, that should not be confused with an equal distribution of trades. In fact, the Volatility Barometer does spend a significant amount of time in the 20 - 40% section. 41.7% of all trading days back to January 2011 have been in this 20 - 40% range.
So our "Short Volatility" range where we hold SVXY is not held only 20% of the time. The strategy has actually held short volatility positions 41.7% of the time. It used to be ZIV, now it's SVXY, but the position is the same, it's a short vol position on 41.7% of days.
That's important to know, and this is why I do consider the VB Threshold strategy a "volatility" strategy. Even though it also holds stocks and bonds in some of the other less advantageous sections, short and long volatility does account for nearly 50% of the positions. 41.7% for short vol and 5.7% for long vol.
Short Volatility performance:
So the big question is, why do we only short volatility during the 20 - 40% section? Why not anything below 50% or 60% and get more trades in?
Well, I'm a quant guy and I only do things that have a mathematical reason to do so. I can totally understand people thinking in theory that short volatility works anytime the market is not crashing. That seems to be the prevailing strategy of a lot of people (especially on Twitter) to just short volatility most of the time and then hang on for dear life when the markets are crashing. But that theory/strategy is quantifiably unprofitable. Short volatility positions do the vast majority of their good work during a specific range.
Performance of Short VXX during each 20% quintile:
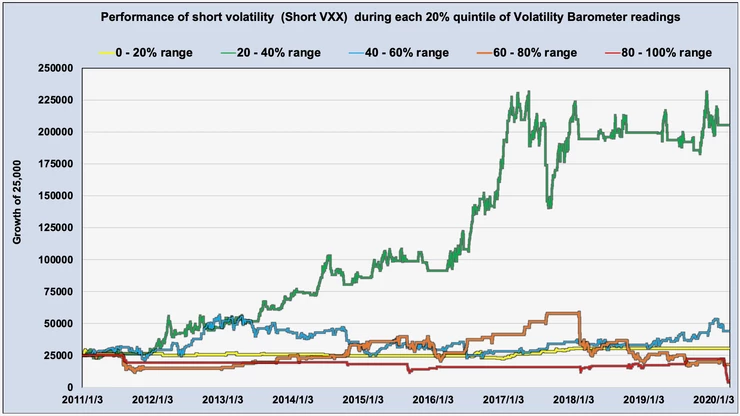
Green - It's not hard to see where the bulk of the gains are coming from. That 20 - 40% section is really the sweet spot for shorting volatility, and the rest are basically just a random walk.
Blue - It's true the 40 - 60% range ended up profitable after 10 years, but it did so with a massive 50% drawdown that lasted 7 years before breaking even.
Yellow - The 0 -20% section also finished the 10 year period slightly on the positive side, but the problem there is it was only due to the low volatility year of 2017. Every other year was flat or losing money and not worth bothering with.
Orange - Even the 60 - 80% had a few pockets of success, again mostly in 2017, but those drawdowns for the orange line are insane and absolutely not worth taking.
Red - If anyone is tempted to try to play the contrarian "bottom catcher" and short volatility when the Volatility Barometer is in its highest range, that red line should be a quick reminder that it doesn't work at all. The Volatility Barometer rarely gets over 80%, and when it does there's a good reason for it.
I'm sure I'll get follow up emails today asking about expanding the 20 - 40% window to include a small amount of the adjacent sides so let's just address that now. This next chart is showing just the 15 - 20% range, and the 40 - 50% range.
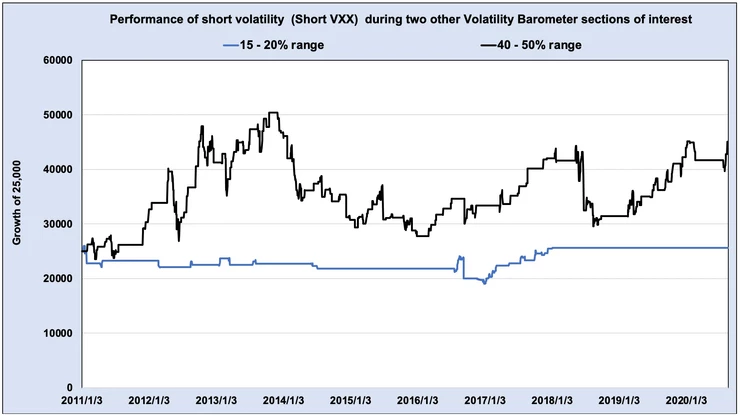
Again there's small pockets of success there for both of them, but nothing special enough to really regret not taking part in it. And certainly those massive drawdowns aren't anything I'd really want to participate in. So a trader could if they wanted try to include those ranges, but for me, I don't like risking increased drawdowns unless I really believe the reward will be worth it.
Investing is all about risk vs reward and trying to find the best balance. For me and my money, the 20 - 40% section of the Volatility Barometer is the sweet spot for shorting volatility, and everything else outside that is probably not worth the drawdowns. For those other sections, stocks and bonds do the job nicely.
Take Control of your Financial Future!
Profitable strategies, professional risk management, and a fantastic community atmosphere of traders from around the world.
