

Is the Market Crashing? - The Cash VIX Term Structure might know the answer
Jul 19, 2021VTS Community,
I've timestamped our most recent livestream from Saturday and will send that out to the general VTS newsletter today so you can check it out on the rebroadcast. There was a question in there about which of the "Cash VIX Term Structure" metrics moves the fastest. Those are the VIX9D, VIX, VIX3M, VIX6M, VIX1Y indexes for the newer subscribers.
The short answer is, the VIX9D:VIX will move the quickest because it's the shortest time frame metric. The VIX9D is measured over just 9 days and the VIX is 30 days, so any market fear is going to show up in that ratio before it will the longer dated ones.
It's much like moving averages which most people are probably more familiar with. A 10-day moving average is going to move and reflect change a lot faster than a 200-day moving average will. The shorter the time frame, the quicker the metric will react because any single day is a much higher percentage of the overall calculation. With a 10-day moving average, if 9 of those days are smooth sailing but then you get a big market drop on day 10, that will still be few enough values that it will change the overall average. However, 1 bad day within a 200 day metric isn't going to make a dent. You'd need several larger values in a row to start affecting the overall average when talking about 200 data points. The Cash VIX Term Structure functions the same way.
So is the market crashing right now?
* Remember to follow me on Twitter: https://twitter.com/VolatilityVIX
Since the market seems to be deciding whether it's going to crash or not here I thought now would be a great time to get the ball rolling for anyone who wants to actually start paying closer attention day to day and see how this develops. Starting with the beginning of July, we can track a few of them over time and you'll actually see how this curve moves around given market movement.
If we do get an all out market crash here and we see the S&P drop 10% or more in the coming days, you'll definitely see a curve that looks substantially different than it does now. If the fear builds high enough we'll even see a curve that's completely inverted from the shape it is now.
Friday July 2nd, 2021:
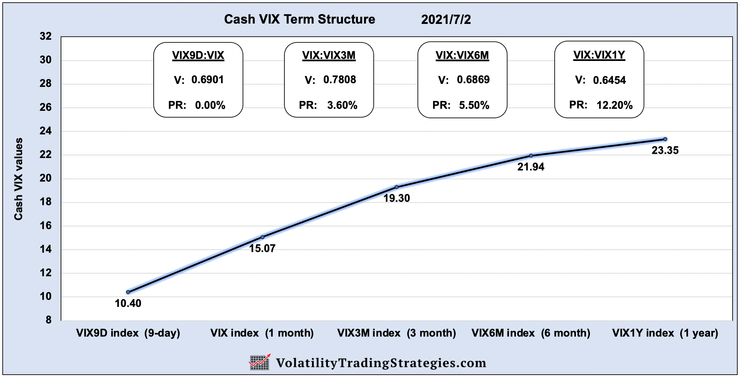
This is a really strong curve for anyone who wants to be bullish the market. Not only do we have each further dated index higher than the shorter dated ones (in contango) but it's also showing low percentiles which means compared to history those metrics are in their lower ranges as well.
Friday July 9th, 2021:

We can see here that the entire curve shifted upwards and each value is higher compared to itself from the previous week, and each percentile ranking compared to history is higher as well. Not a red flag or anything, it's still very mild, but the market was definitely pricing in a little more uncertainty the week of July 9th than it was the pervious week of July 2nd.
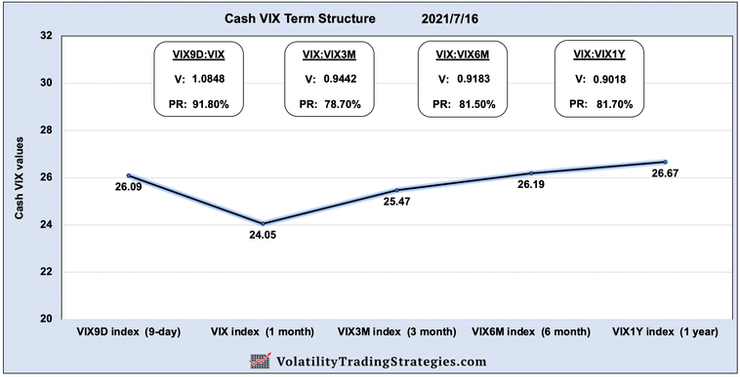
Friday July 16th, 2021:

Again here the curve made a substantial jump upward with each value significantly higher than it was compared to itself a week previous. The percentiles as well are now in the 25-50% range, which is still below average but obviously substantially higher than previous weeks and moving in the wrong direction
Another thing to note, and this gets to the speed of change question from the livestream, we can start to see the VIX9D and the VIX have a little kink. This is caused by the VIX9D being the fastest moving index and in an environment of building fear, this metric will always move first. I always show it like this:
Stable market: VIX9D < VIX < VIX3M < VIX6M < VIX1Y
Unstable market: VIX9D > VIX > VIX3M > VIX6M > VIX1Y
Now typically fear doesn't happen overnight and we won't see this curve invert in a day. It could happen, but that's definitely not the norm, usually it takes a week or two before the fear starts to get priced in. So it will move in stages.
VIX9D > VIX - Pay attention
VIX > VIX3M - Major red flag and significant fear
VIX3M > VIX6M - Market feels the issue has staying power
Completely inverted curve - Markets are crashing
Today July 19th, 2021:
As of today, the market is in the initial stages of a correction and we see the front end of the curve kinked and inverted to where the VIX9D is well above the VIX and it's even above the VIX3M.
This, along with dozens of the other metrics we track is where we at VTS really start to pay attention. It's not a full on market crash yet and perhaps it won't materialize into one, but those of us who understand how to protect capital know we can't wait until after the fact to find out.
All larger crashes begin with a first stage of warnings. And yes, even Black Monday Oct 1987 had significant warnings and declines before that fateful day, so did Volpocalypse, so did Q4 2018, so did the Covid pandemic. There are nearly always warning signs well in advance, and it would be wise for investors to look for clever ways to detect them early.
The Cash VIX Term Structure is one of several indicators that can be a fantastic addition to your risk management toolbox, and today it's screaming warning signs. Only time will tell if it was the real deal or a false alarm, but the red flags are everywhere and we need to exit to safety now...
Take Control of your Financial Future!
Profitable strategies, professional risk management, and a fantastic community atmosphere of traders from around the world.
