

The VTS Volatility Barometer can go WAY lower
Apr 13, 2021I've had a few interesting comments from people lately regarding what they felt was a potential pattern in the VTS Volatility Barometer. I suspect it has more to do with how I've presented the data lately in the Volatility Dashboard so I think I should clear up any confusion.
In general what they are saying is, there seems to be a strong pattern of the Volatility Barometer decreasing down towards the lower 1/3 range (marked in green) and then reversing and going higher again.
I don't know if it's coming from their technical analysis background or just a simple observation, but given the 1 year chart of the Volatility Barometer I can hardly fault someone for thinking that:
Volatility Barometer for the last 1 year:
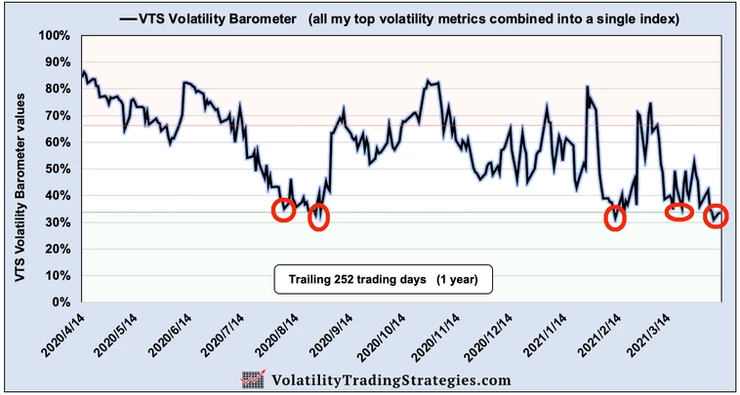
When viewed this way that observation does seem to have some merit. Five times now in the last 1 year we've dipped just below the 33% level only to see it reverse and go the other way. This might give people the impression that when it gets close to that green range it would be time to move to safety positions, or perhaps even worse, to actually try to time the next volatility spike and BUY the VXX or UVXY (insert scary music)
Their observation is sort of true...
Now before I "debunk" this idea I do want to stress that there is some truth to the claim that it seems to get exhausted at lower levels, but it's just not at the 33% level.
The way volatility works in general, it does have a mean reverting nature to it. Now yes, it's median and mode reverting as well so all my fellow math geeks can relax, but volatility does have a mean reverting aspect. When it gets to historically high or low levels there is diminishing probability that it will stay there. You'll see in a minute when I show the full history of the Volatility Barometer there are high and low levels that occasionally get touched, but it's very unlikely they will ever be breached. Things can only go up or down for so long before it runs out of steam.
But not really true...
Let's take a look at the full history of the VTS Volatility Barometer since January 2011 and you'll see what I mean about that 33% level not being the floor. I typically present just the rolling 1 year chart in the daily emails because the long term chart looks pretty messy, but here it is:
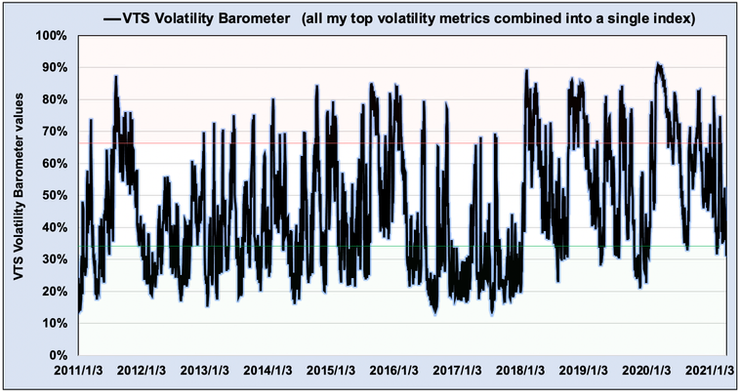
We can see pretty clearly from 2011 through 2017 it was very normal to see the Volatility Barometer dip well below the 33% level, and the true floor where things start to run out of steam is closer to the 18-20% range.
In fact, even after the Volpocalypse event in 2018 we did have a period where it dipped to the low 20's for a few days, and for an extended period in 2019 it went to the low 20's as well. We just haven't seen that yet in 2021.
The Covid crash in 2020 was steep and scary, and it's only natural for the market to need a significant amount of time to work through that fear. I've talked about it quite a bit but there has definitely been a Volatility Regime Change since early 2018:

From 2011 - 2017 the average Volatility Barometer level was about 40%. In the past 3+ years since January 2018 the average reading is closer to 60%. That's a very significant difference, but it's clearly only because there have been 3 major crashes in 3 years. If the market moves towards stability again, this gap will narrow as well.
Recency bias vs long term averages:
So it's pretty clear that although there has been a volatility floor around the 33% level in the last 1 year, that is in fact only a short period of time. When viewed over the long term it's much lower than that. If a trader was just focused on the rolling 1 year, that would be recency bias and they would be allowing recent evens to unduly influence their trades. When markets revert back to the long term averages that could be a problem.
So when will this reversion to the mean happen? Well that is unknown of course, but I for one would rather trust 10 years of data than 1 year. Obviously there's going to be market corrections along the way, that's perfectly normal, but if 2021 can navigate without any serious crashes I suspect we'll see the Volatility Barometer dip well into the 20's and perhaps even the teens at some point this year.
Take Control of your Financial Future!
Profitable strategies, professional risk management, and a fantastic community atmosphere of traders from around the world.
