
Volatility ranges are way up since the 2018 Volpocalypse event
Feb 18, 2026
A VTS member asked a very specific data related question, and I thought this may also be of interest to the rest of you:
"In the last 5 years, what percentage of days has the Defensive Rotation Strategy been in safety XLU positions compared to before Covid?"
He's essentially wondering if there has been an increase or decrease in safety positions in the last 5 years. So first the data, and then afterwards I'll draw a conclusion.
So of course we could do this type of analysis for any of our strategies, over any time frame we choose. In this case we'll focus on Defensive Rotation with the Cash / QLD / XLU / Cash set up
VTS Defensive Rotation Strategy thresholds: Since inception
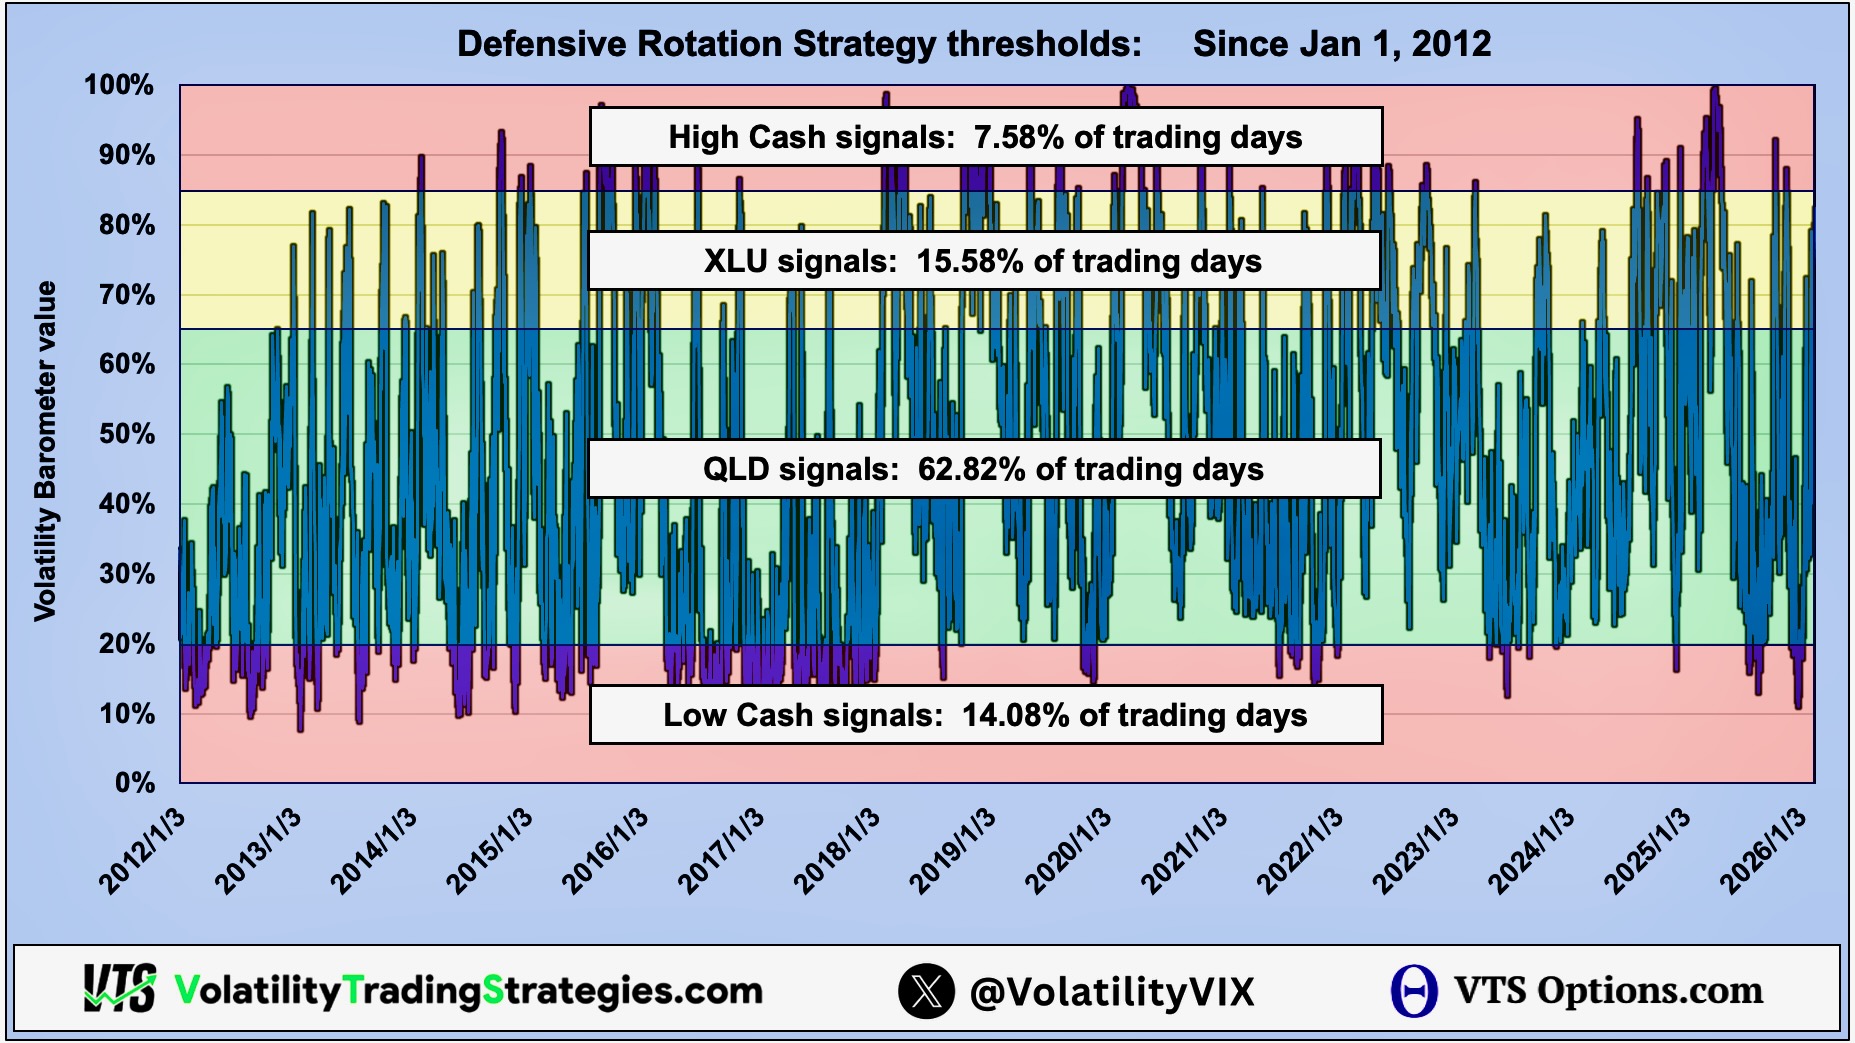
High Cash signals: 7.58% of trading days
XLU signals: 15.58% of trading days
QLD signals: 62.82% of trading days
Low Cash signals: 14.08% of trading days
VTS Defensive Rotation Strategy thresholds: 5-year
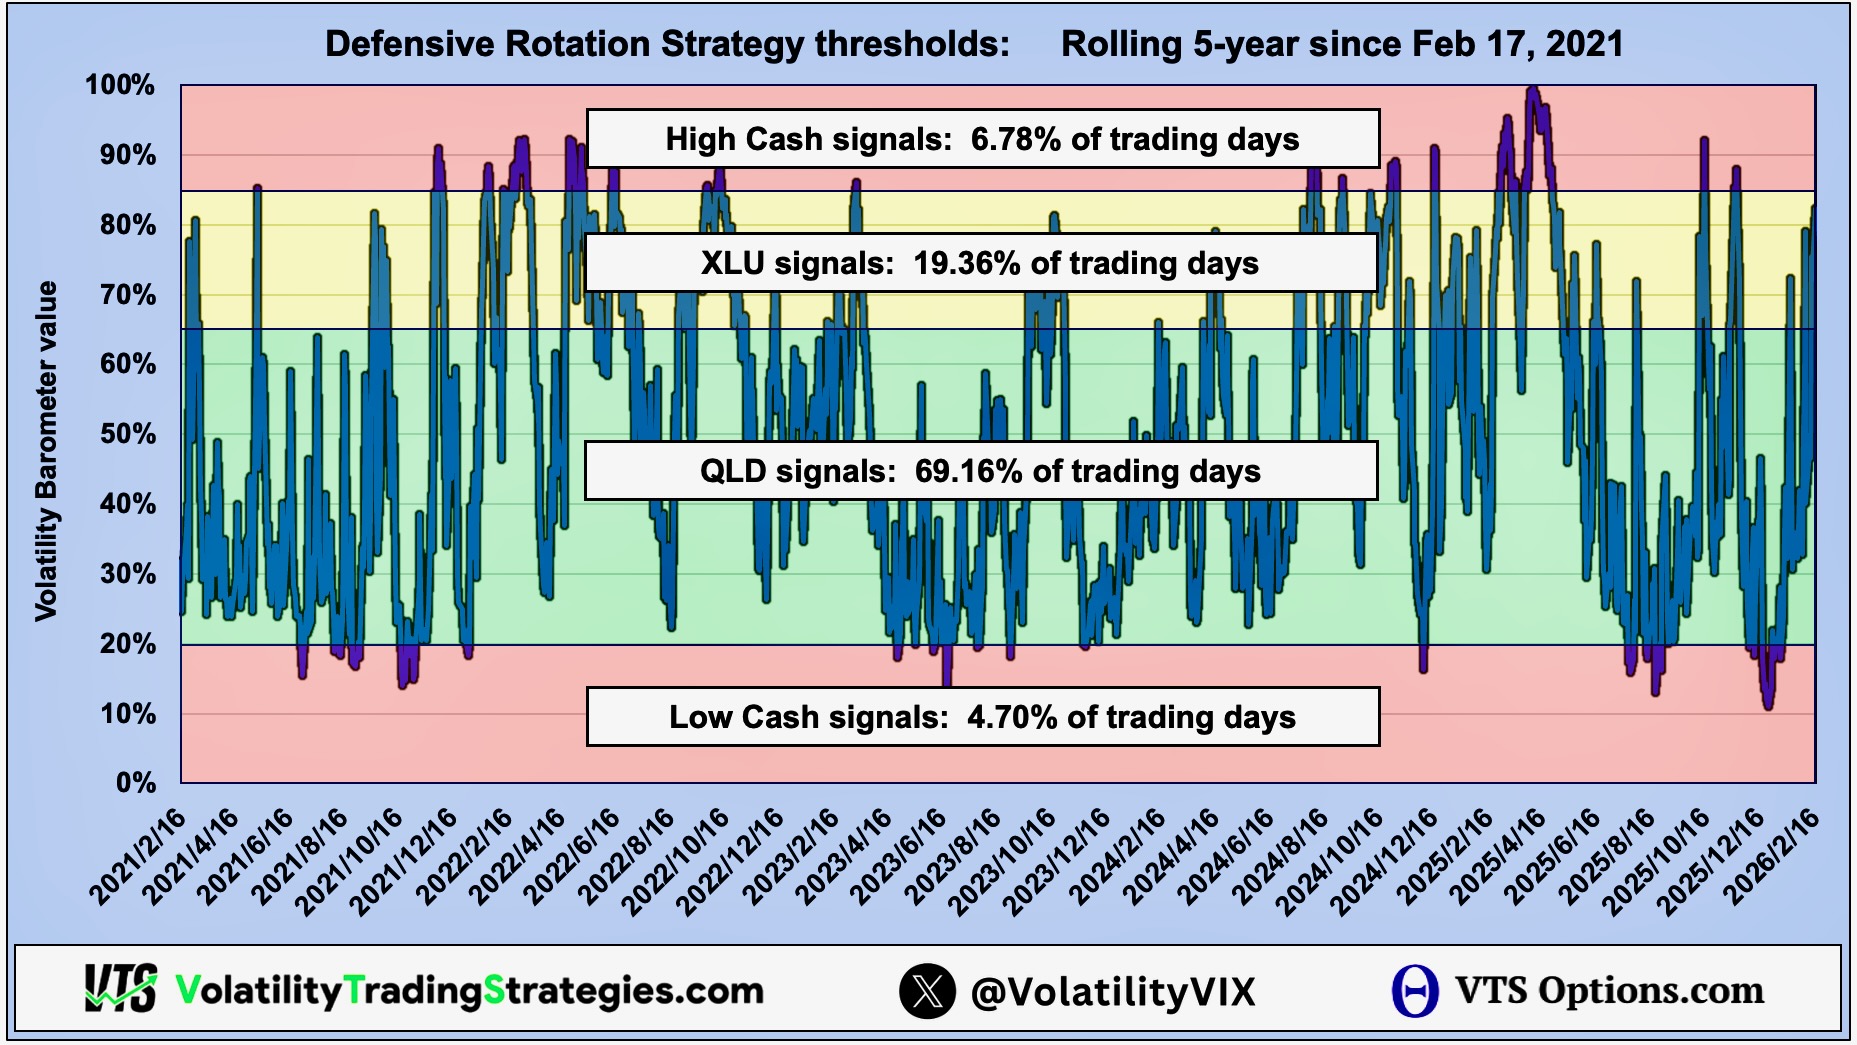
High Cash signals: 6.78% of trading days
XLU signals: 19.36% of trading days
QLD signals: 69.16% of trading days
Low Cash signals: 4.70% of trading days
Volatility has seen an upward shift
Looking purely at the XLU Safety positions as the question asked, yes we can see a small increase in the amount of days we've been in safety. From 15.58% to 19.36%. Now in the grand scheme of things I'd say it's within the same ball park. However, if we include the uptick in Aggressive QLD positions up from 62.82% to 69.16%, we see an even larger difference.
- Since inception the strategy has spent 78.40% of trading days in QLD and XLU
- In the last 5 years the strategy has spent 88.52% of trading days in QLD and XLU
- Additionally, there has been a noticeable decrease in the number of days spent in Low Cash signals, from 14.08% down to just 4.70%
As a whole we can conclude that average Volatility ranges we've seen in the last 5 years are definitely higher than the entire period since 2012.
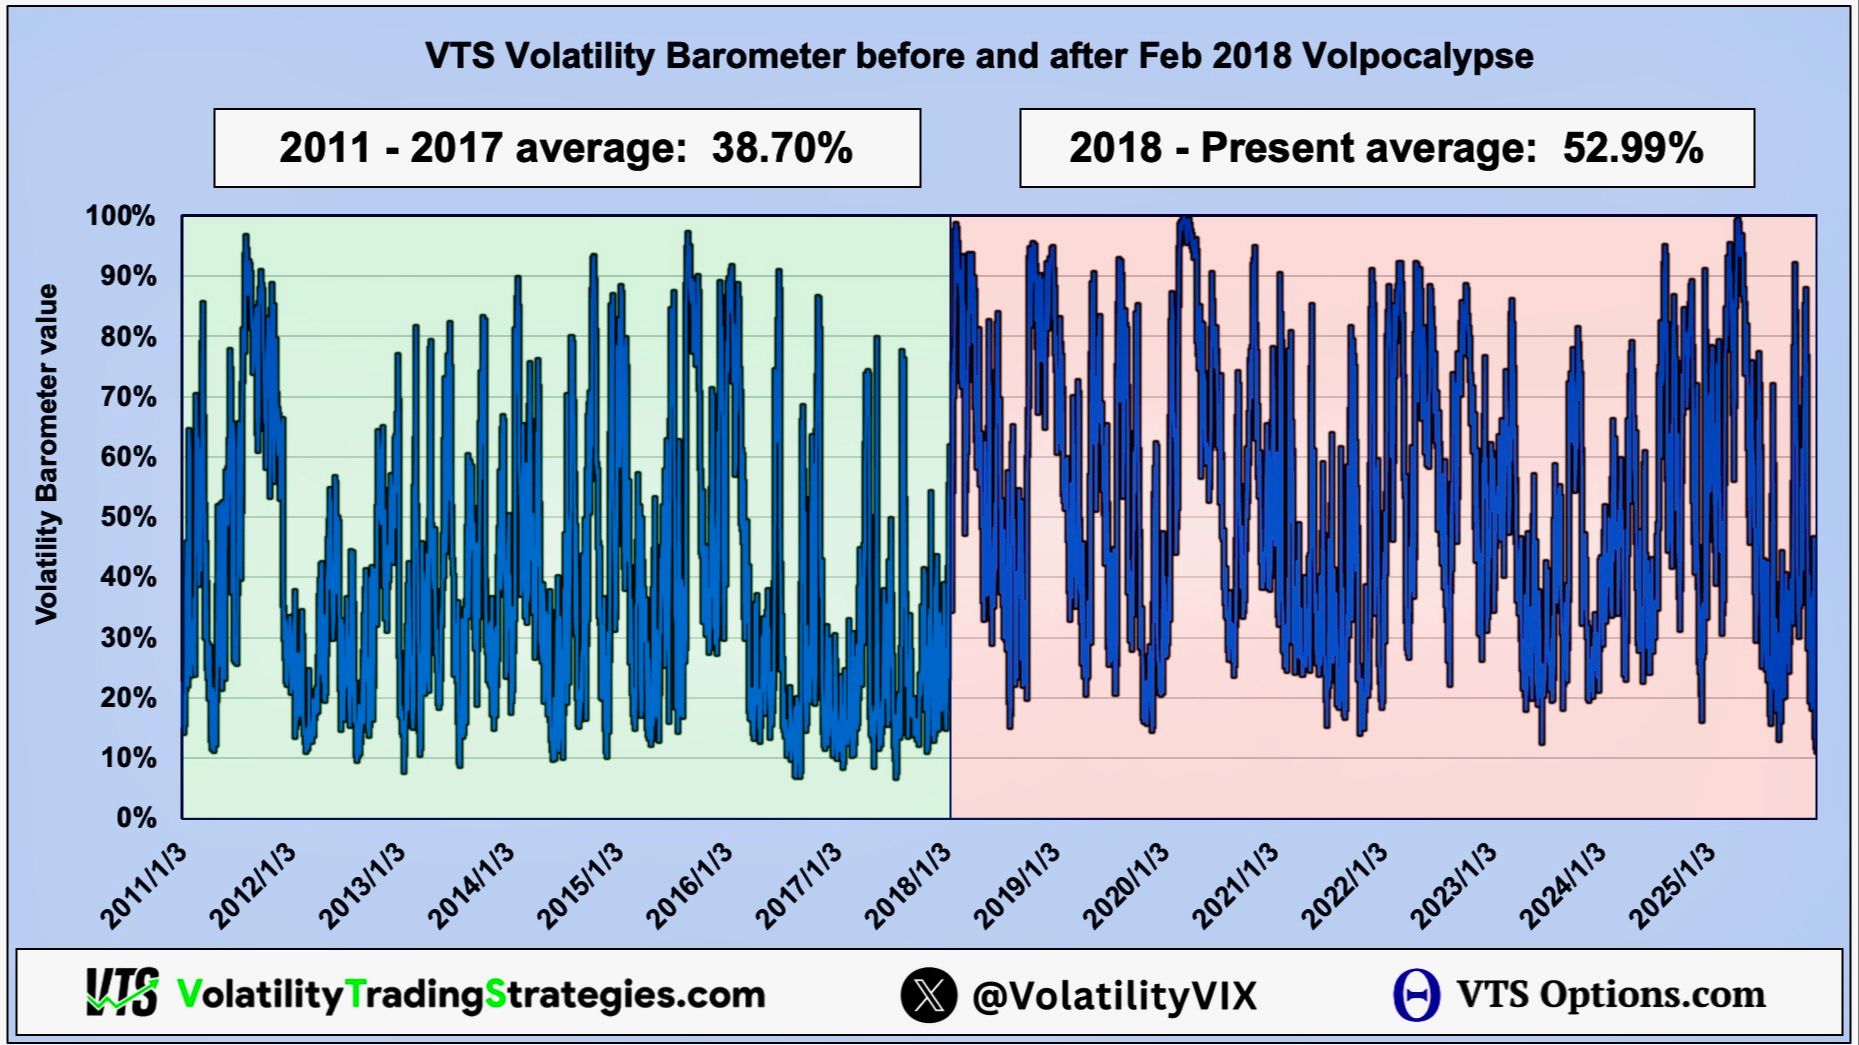
Pre / Post Volpocalypse
Given that we're Vol traders, February 5th, 2018 is quite a significant day. It was easily the largest Volatility specific shock the market has seen since Black Monday in 1987 so it's natural for that to have shifted investor behavior a little bit.
VTS Volatility Barometer averages before and after Volpocalypse:
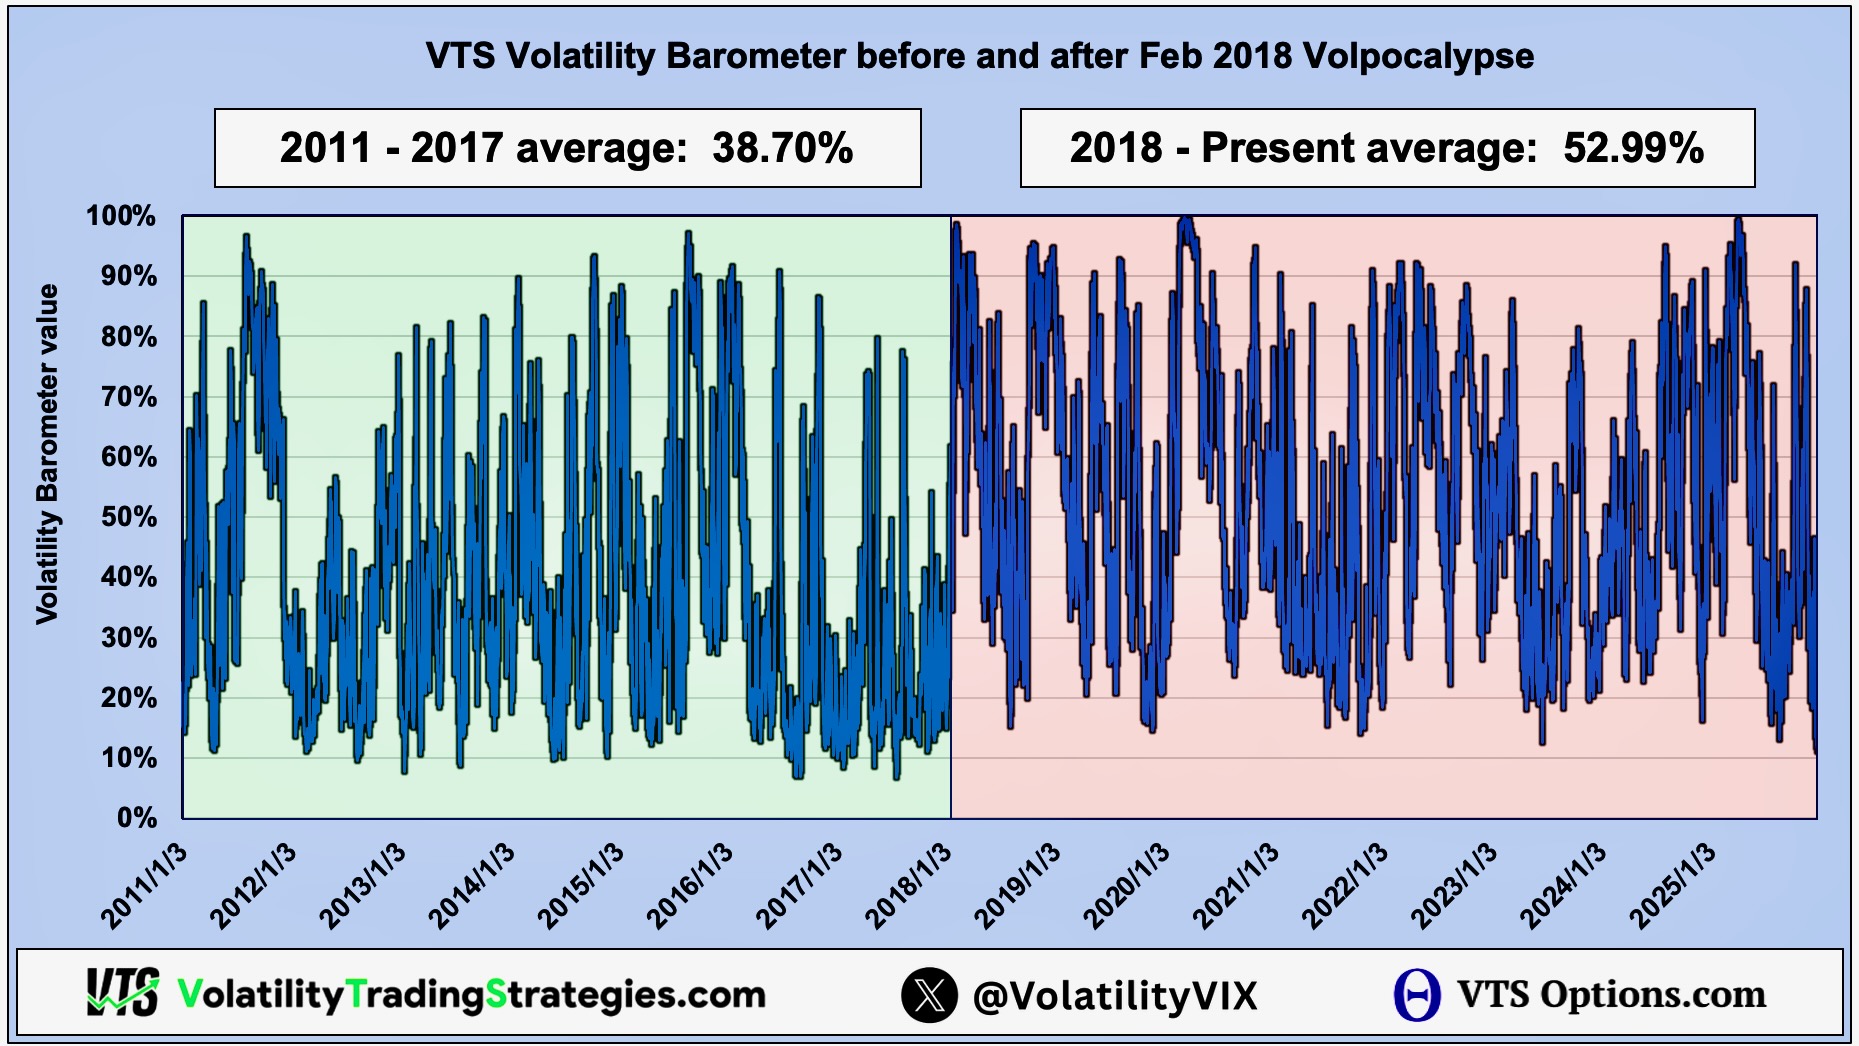
Viewing it through the lens of pre/post Volpocalypse we can clearly see a significant rise on average Volatility levels. This will mean that our strategies including Defensive Rotation will spend more time in the middle and upper middle ranges of QLD and XLU than previous years, and less time in the lower range. That is clear in the chart, with very few values below 20%.
Mid to High Vol regime is here to stay
Given the geopolitical risks, and the political uncertainty in the United States with the upcoming MidTerms in which the Republicans are surely going to lose at least the House, and also just the general faltering economy, I find it very hard to believe we won't see this trend continue.
It's going to take a full on financial crisis to reset Volatility expectations to what they were 10 years ago...
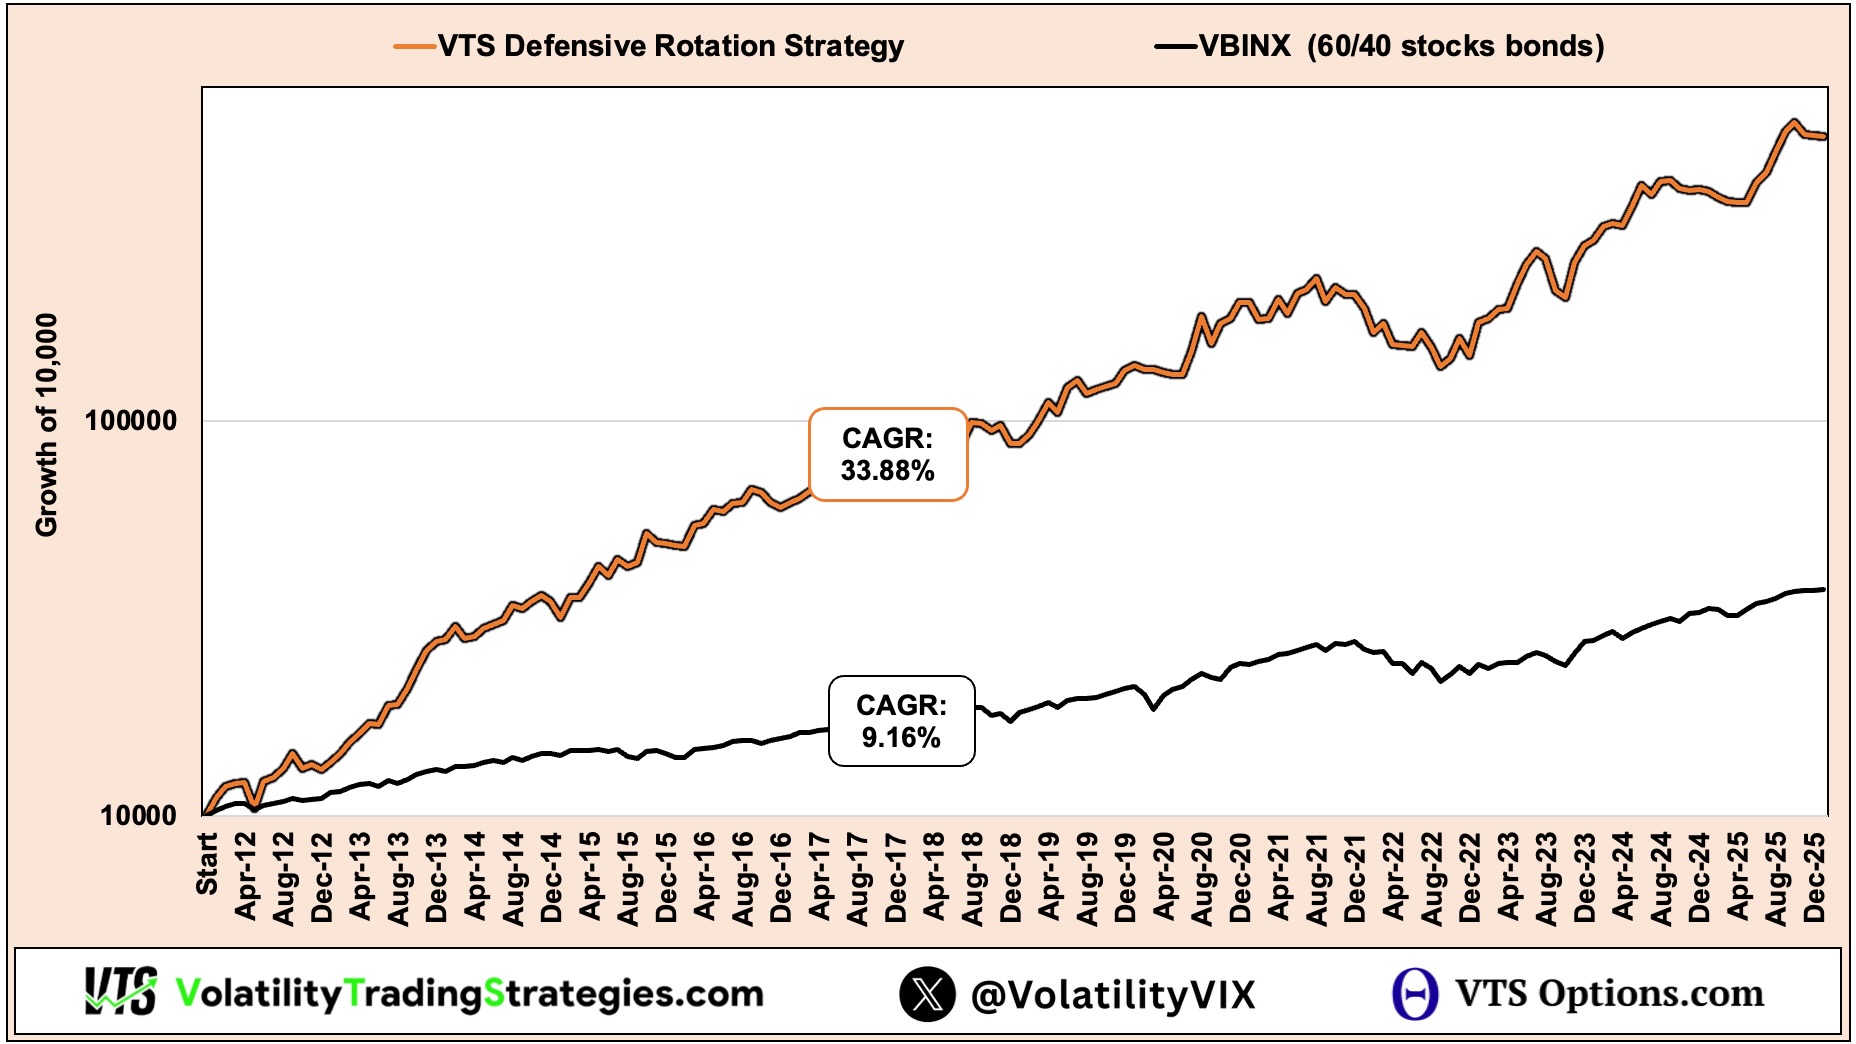
Defensive Rotation Strategy is still crushing it
Despite this obvious rise in average Volatility levels, and a shift in the composition of time we spend in each asset range, fortunately it has not affected performance. The strategy is designed to trade in all environments, and aside from the outlier 2022 it's done it's job exceptionally well.
Take Control of your Financial Future!
Profitable strategies, professional risk management, and a fantastic community atmosphere of traders from around the world.
