

Small change in our VTS Volatility Barometer methodology
May 06, 2025
VTS Volatility Barometer visual change
For anyone who's watched my livestreams you'll know some version of the following question comes up every few episodes:
Why doesn't the Volatility Barometer ever go to 100%?
This is what the current Volatility Barometer looks like as of yesterday, May 5th 2025. This is the one you've all seen for years
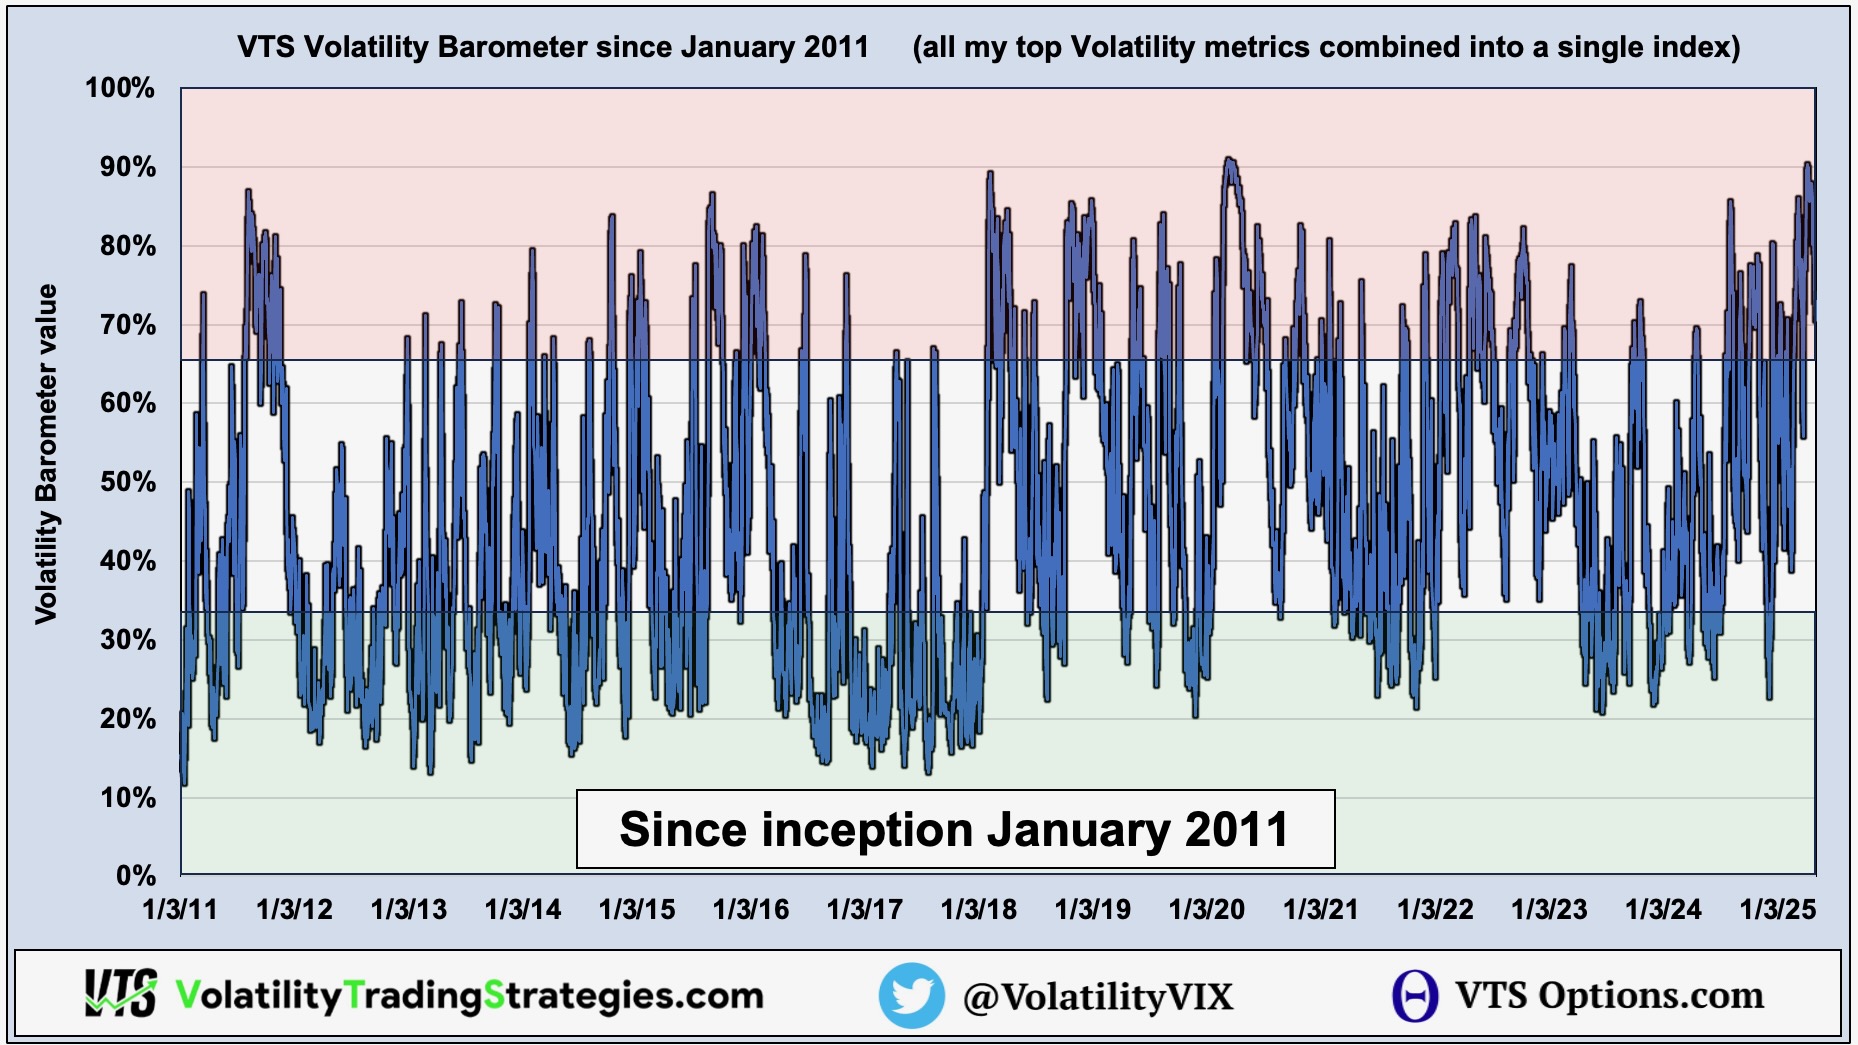
People are obviously going to notice that it's never been higher than 91%. Well that's strange right? Certainly during the Covid pandemic in 2020 the Volatility Barometer should have hit 100%?
The truth is yes, that period was the highest it's ever been. It didn't go over 91% simply because of how I calculate it. It's not actually that difficult to just run the numbers in a slightly different way and end up with something that does go from 0% - 100%.
YouTube videos can't be edited
I've held off for so long making this change simply because of the fact that I already had so many YouTube videos showing the original way of calculating it, that I just kept putting it off. If I make the visual change and have it reflect 100% as the highest ever value, it will mean there are inconsistencies with the YouTube channel and all my old videos.
If I don't do it now, I likely never will
It's time to just bite the bullet and make the change. Yes, it will definitely mean that no doubt there will be some questions coming up asking about why there are differences. I'll just have to answer those as they come up and hopefully over time they are less and less.
Even though for me internally, this is purely a visual change that means nothing to how I view the Volatility Barometer. Intuitively though, it does make more sense for newcomers to VTS to see something that is closer to reflecting 0% - 100% as the extremes.
The new Volatility Barometer
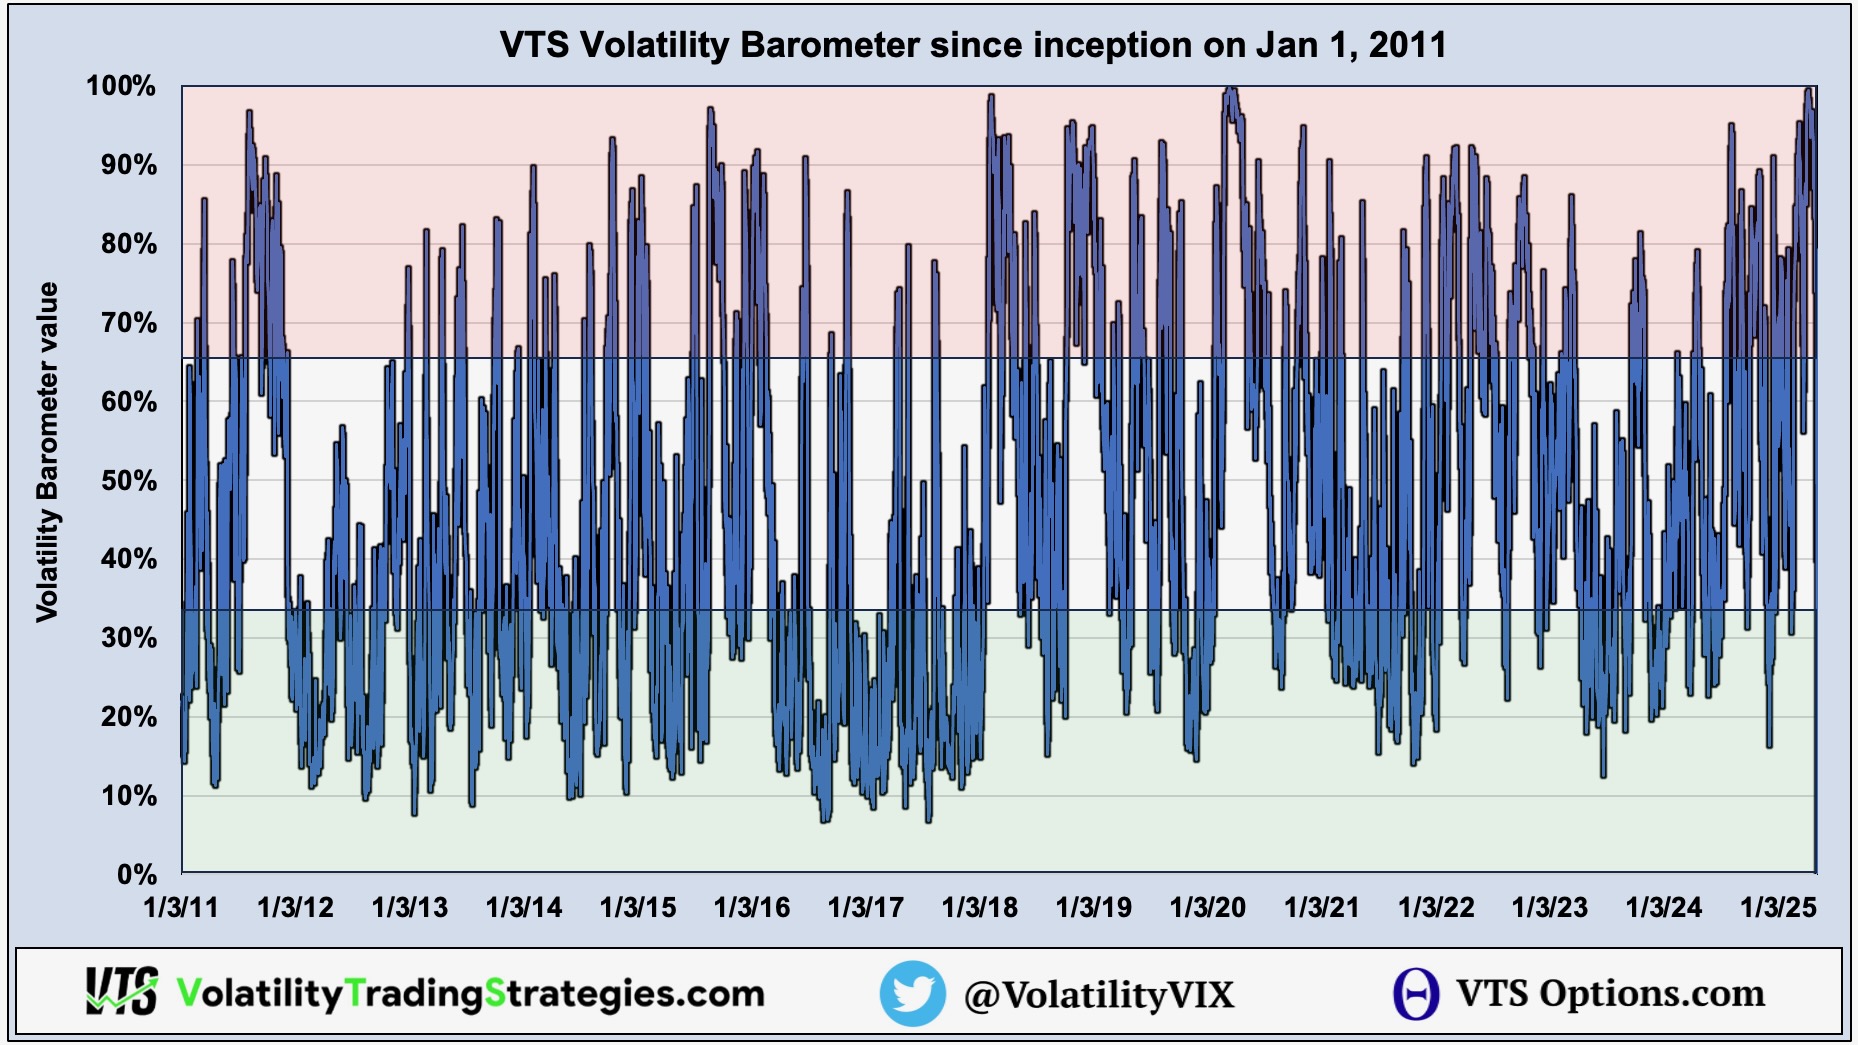
Here's what the Volatility Barometer would have looked like yesterday May 5th, 2025 with the new way of calculating it:
* Remember this is purely visual. The strategy signals would not have changed at all. Those are still always based on rolling percentiles so no visual changes could ever influence that.
Why didn't it ever hit 0%?
So we can see with the "new" Volatility Barometer above, it did hit 100% during the Covid pandemic. However, even during the low Volatility in 2017 it never did hit 0%
I'm currently using 13 different Volatility metrics within the Barometer, and there are a couple of them that behave more as contrarian signals during very low Volatility. When I run the numbers during extreme low Volatility, it's very unlikely that all of them will be at 0%.
Even though standard metrics like VIX Futures and the Cash VIX values will hit 0%. Other metrics like the Traders VRP, the Cash VIX Oscillator, they "may" not.
Now it's not impossible that in the future we do see a 0% value. So far it hasn't happened but that doesn't mean mathematically it couldn't. It'll be interesting to keep track of this and see what kind of environment would flash a 0%.
For values near 100% we know, it's crisis. Covid in 2020, the recent crash due to Trumps Tariffs, Volpocalypse in 2018, the China hard landing scare in 2015, the Flash Crash in 2011. Those were all periods where we saw high 90's percentiles.
Visually, the Volatility Barometer has been updated
It may take a little while for all the trade dials to be exactly right visually. Because each of them use a slightly different variation of the Barometer, I'll have to see how it looks visually through different environments. It'll be close enough now though so you can start adjusting your eyes :)
Take Control of your Financial Future!
Profitable strategies, professional risk management, and a fantastic community atmosphere of traders from around the world.
