

"Short Volatility Bias" in our VTS Volatility Dashboard
Jan 26, 2023
VTS Community,
In last Friday's Volatility Barometer Ep.48 livestream we had a very good question from someone that I want to unpack further here today:
In your Volatility Dashboard, what is "Short Vol Bias?"
The VTS Volatility Dashboard:
One of the reasons I show so much data in our daily trade signals emails is because I know some of you are actually trying to learn from my investing methods and eventually take the reins of managing some of your portfolio yourself. That's great and I always encourage people to be more active with their investing. I will always do my best to speed up your learning curve through additional educational content.
* Remember the average person spends about 2,000 hours per year making their money. I don't think it's too much to ask that they also spend about 5 minutes a day making sure it's being invested effectively. It's as simple as reading a daily email and taking a quick trade if necessary. A minimal commitment but trust me, your retirement account will thank you down the road :)
What does our "Short Vol Bias" actually mean?
Both our specialty and general Volatility metrics dashboards have a column labelled Short Vol Bias. Within that, they are marked either higher or lower.
Higher: This means for that specific metric, values in the higher range would be more advantageous to be short volatility
Lower: This means for that specific metric, values in the lower range would be more advantageous to be short volatility
* You can also use short volatility interchangeably for long equities. They aren't exactly the same thing, but correlation wise short volatility and long equities can be viewed as similar directional market exposure.
Example of "Short Vol Bias" where HIGHER is beneficial
It'll be easier to explain with a real example so let's take one of our metrics from the Specialty Volatility Dashboard called the VTS Cash VIX Oscillator. Remember, anytime you see a blue hyperlink that means there is an article or video explanation. Here's an extended article explaining the VTS Cash VIX Oscillator. That article explains how incredibly valuable the CVO metric is with examples of its effectiveness so check it out later.
* It's a metric I designed the tracks the momentum changes in the Cash VIX Term Structure between the various time frames:
9-day VIX9D vs 30-day VIX vs 3-mo VIX3M vs 6-mo VIX6M
VTS Cash VIX Oscillator is marked in the green box below:
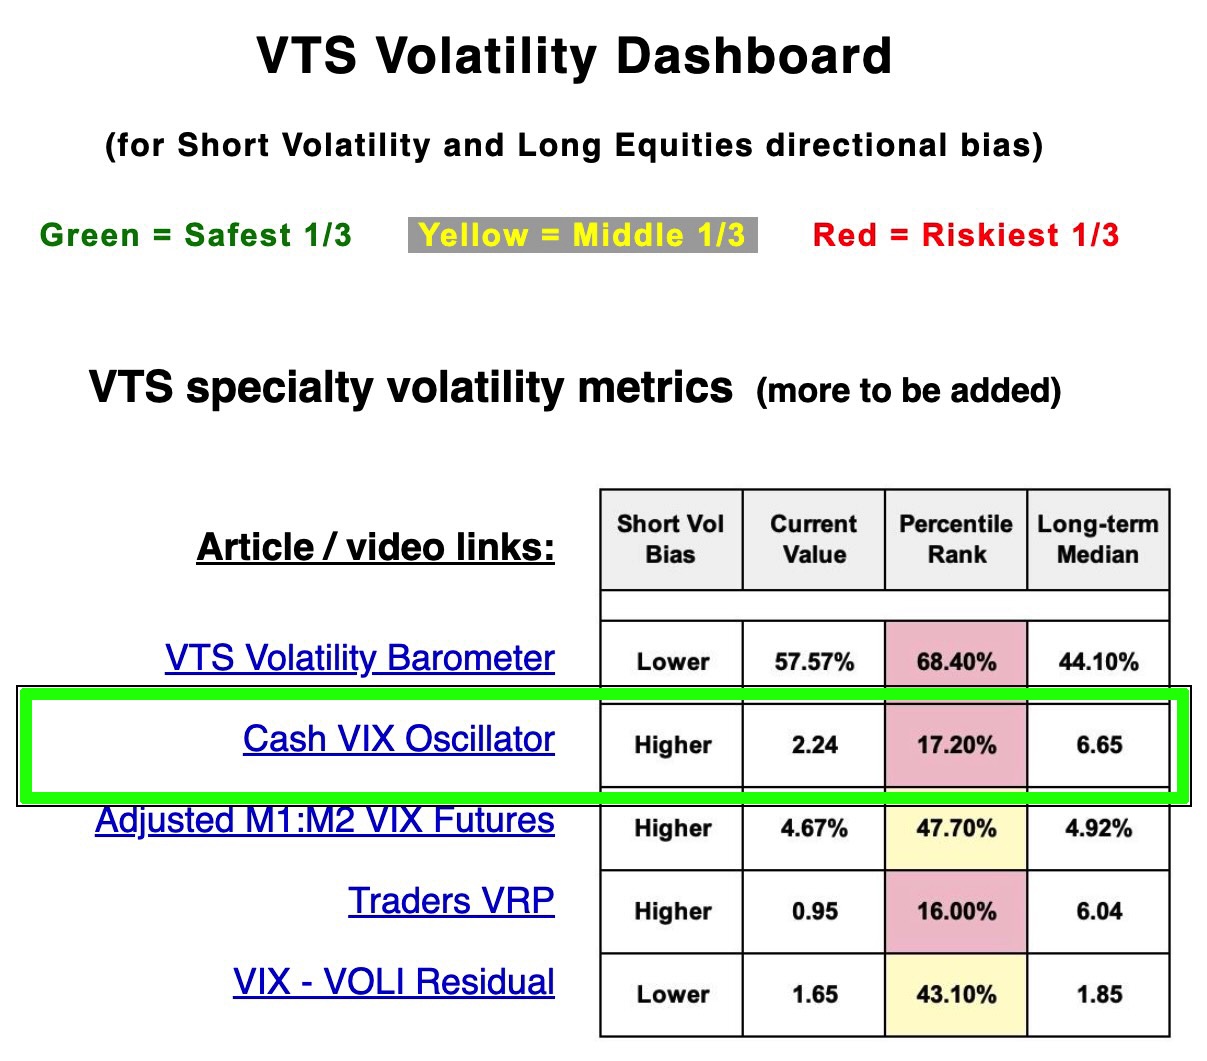
We can see the "Short Vol Bias" is marked higher which means it is in the higher ranges of values where it would be more advantageous to be either short volatility or long equities. Below is a chart of the Cash VIX Oscillator going back to January 2011:
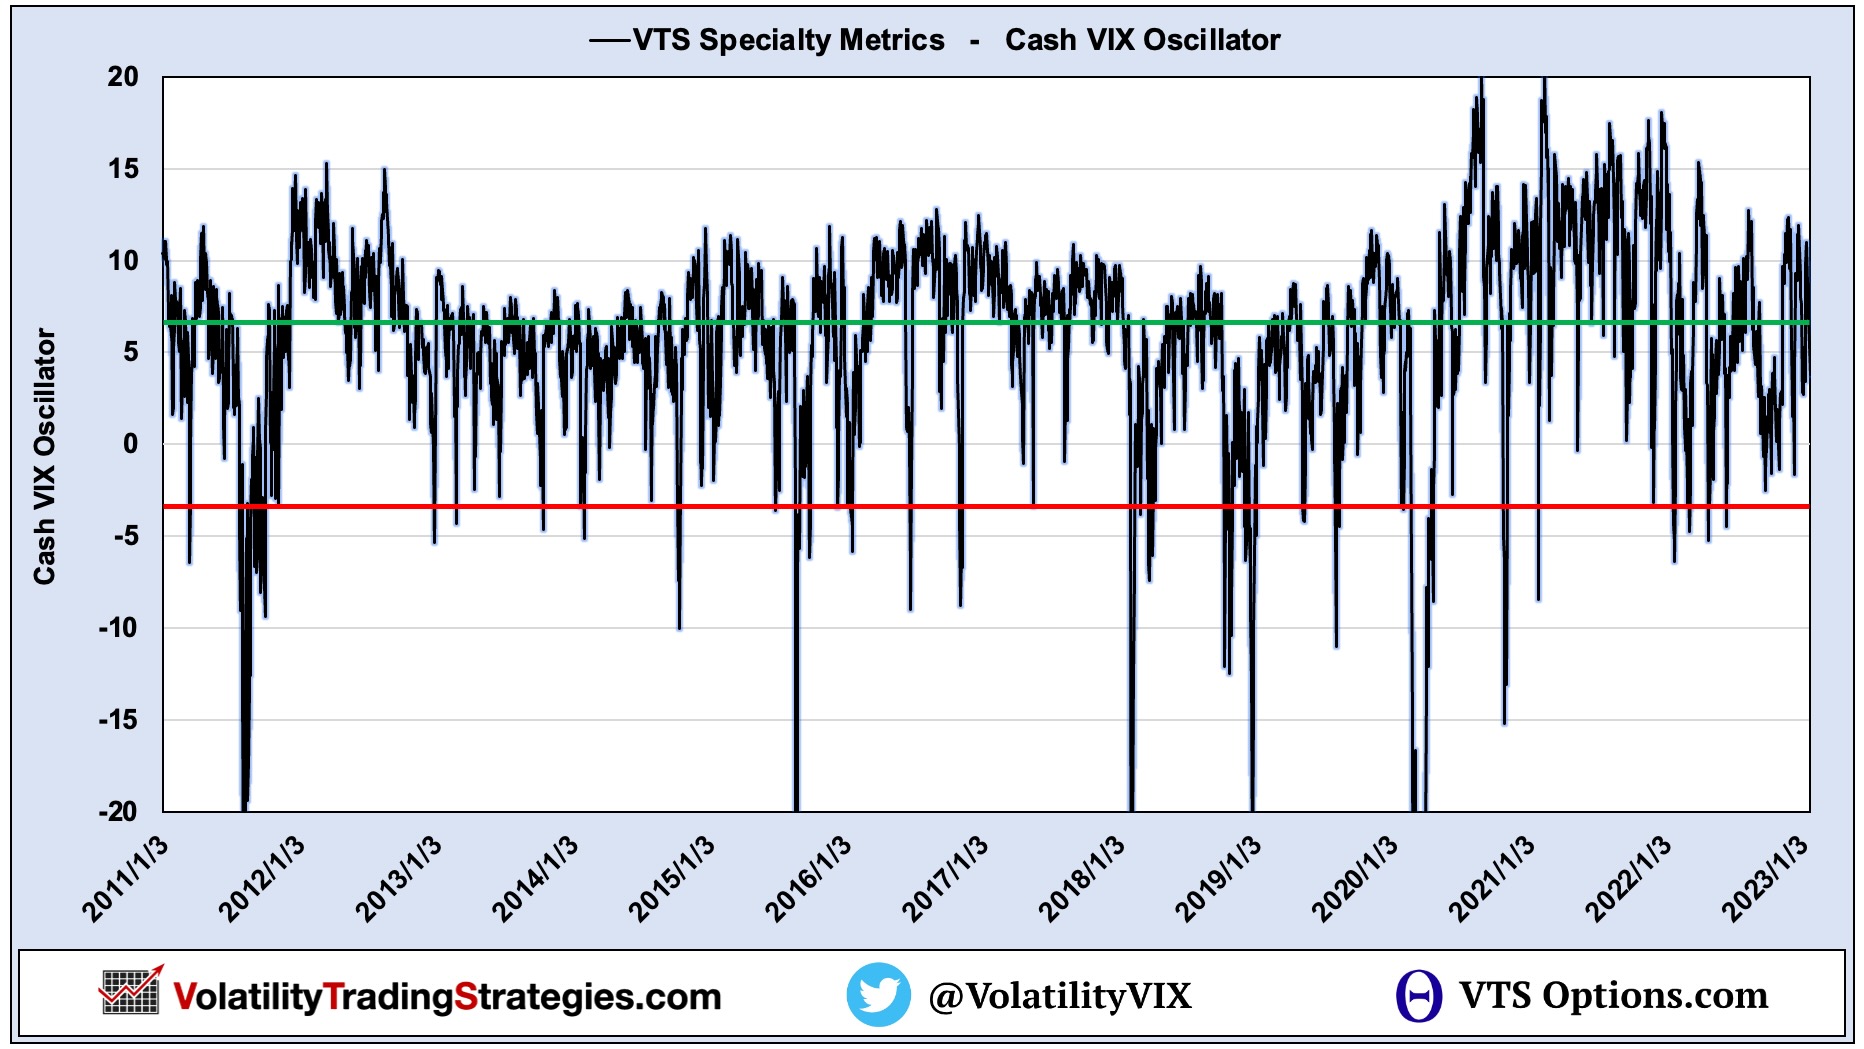
Green line: Represents the long-term Median (50th percentile) of 6.66
Red line: Represents the lowest 5th percentile of values at -3.58
VTS Cash VIX Oscillator has a "Short Vol Bias" of HIGHER
If a trader was using this metric as a filter for short volatility trades, they would only want to be in a position when it's in the higher ranges. Higher Cash VIX Oscillator values are associated with stable markets and historically represent a tailwind for Short Volatility or Long Equity positions.
The median is about 6.66, but anything over say 5 would be a reasonable level. Long-term I've always felt comfortable being short volatility during about 60% - 65% of the most stable periods in the market.
Very low values may be a "Long Vol Bias"
While I haven't explicitly stated it in the dashboards, when the metrics are in the extreme opposite ranges of the Short Vol Bias in the tables, that could also be assumed to be a reasonable level for initiating some Long Volatility or Short Equity positions.
* Now remember, long volatility is a notoriously difficult trade to profit from long-term and you will want to be extremely limited in your exposure to it.
In my experience, somewhere in the 2-3% of trading days exposure to Long Volatility is enough to catch a ride and benefit during the most extreme market crashes, but it's not a high enough exposure level to get punished too harshly when wrong.
When holding Long Volatility positions, you will be wrong quite regularly, get used to it. Long Volatility is an example of a very convex trade where the win rate percentage would be quite low, but long term you may be greatly assisted by the occasional Volpocalypse or Covid crash :)
Example of a VERY rudimentary Short Volatility Strategy
If you're following along here you may start to piece this together. I've given some general guidelines for historically acceptable entries and exits for short and long volatility assisted by that label of "Short Vol Bias"
Cash VIX Oscillator > 35th percentile = Short Volatility / Long Equities
Cash VIX Oscillator < 3rd percentile = Long Volatility / Short Equities
This is very far from a comprehensive strategy and I go much deeper with my analysis and strategies, but it's a very good start. On its own this would likely be better than nearly all of the volatility strategies on offer in the investment space. With a few additional tweaks it could have even better risk adjusted performance long-term.
* To be continued with a future article :)
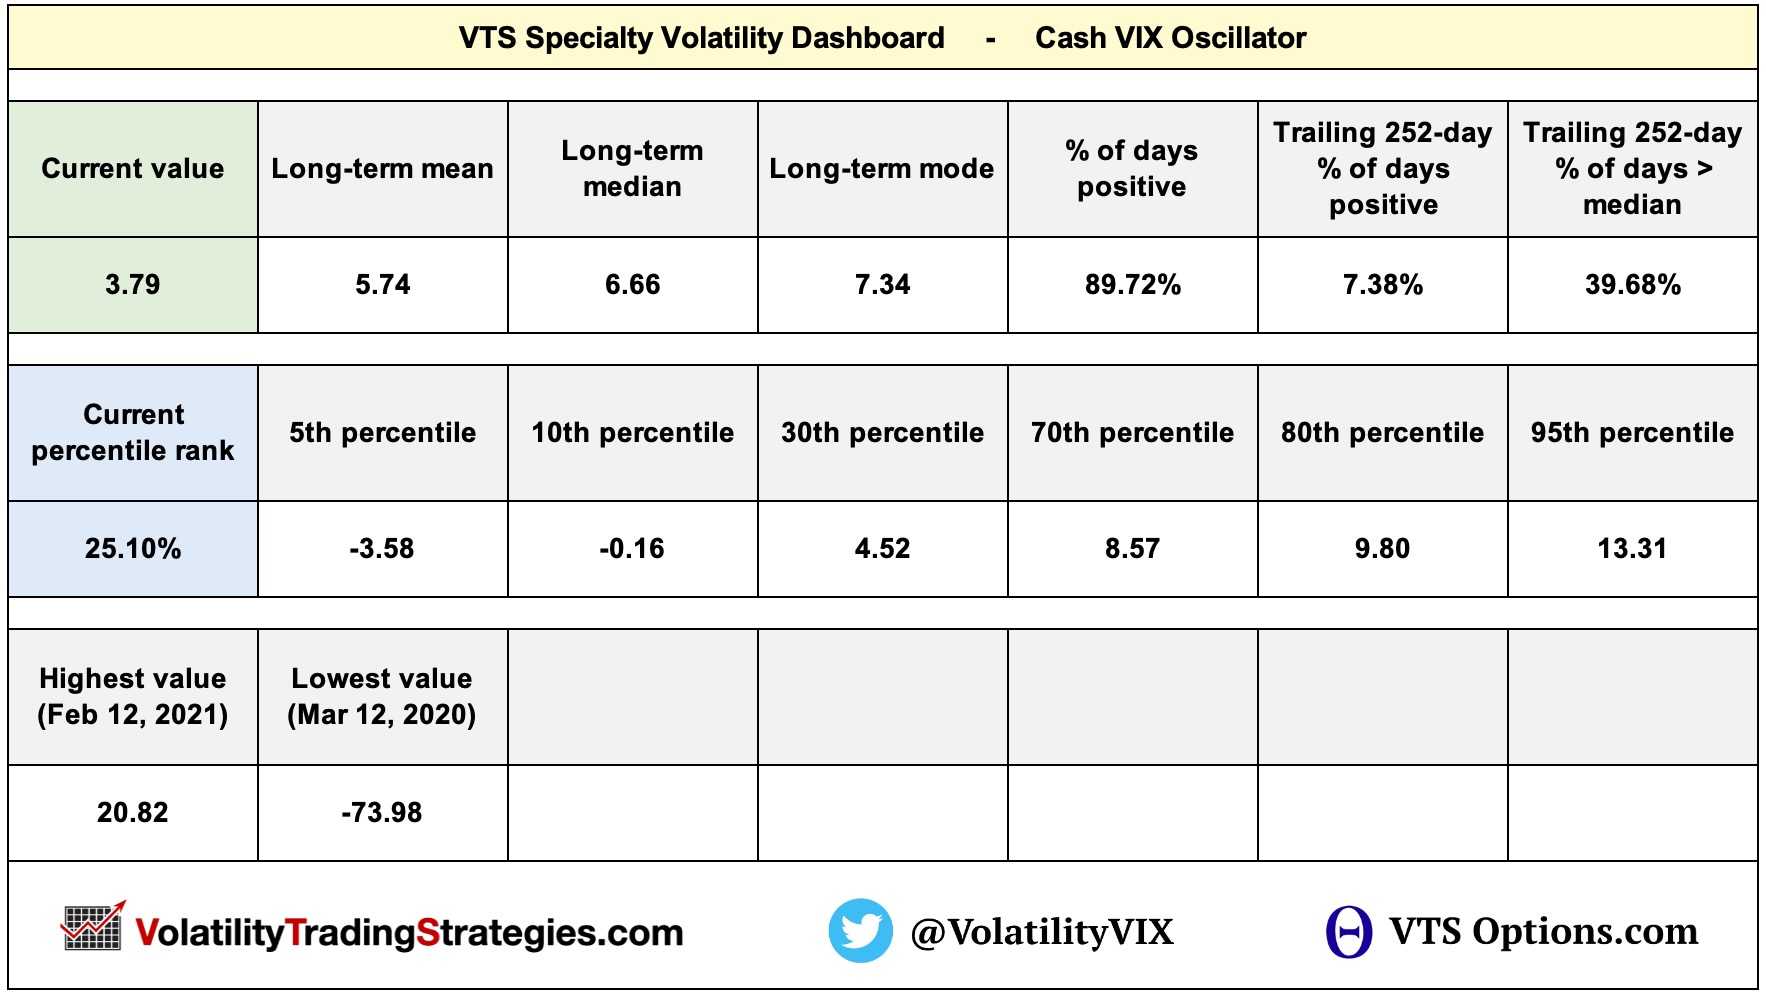
Below are a few more baseline statistics for the Cash VIX Oscillator metric that you may also find useful (from January 24th, 2023) Again, I can unpack some of this further in a follow up article.
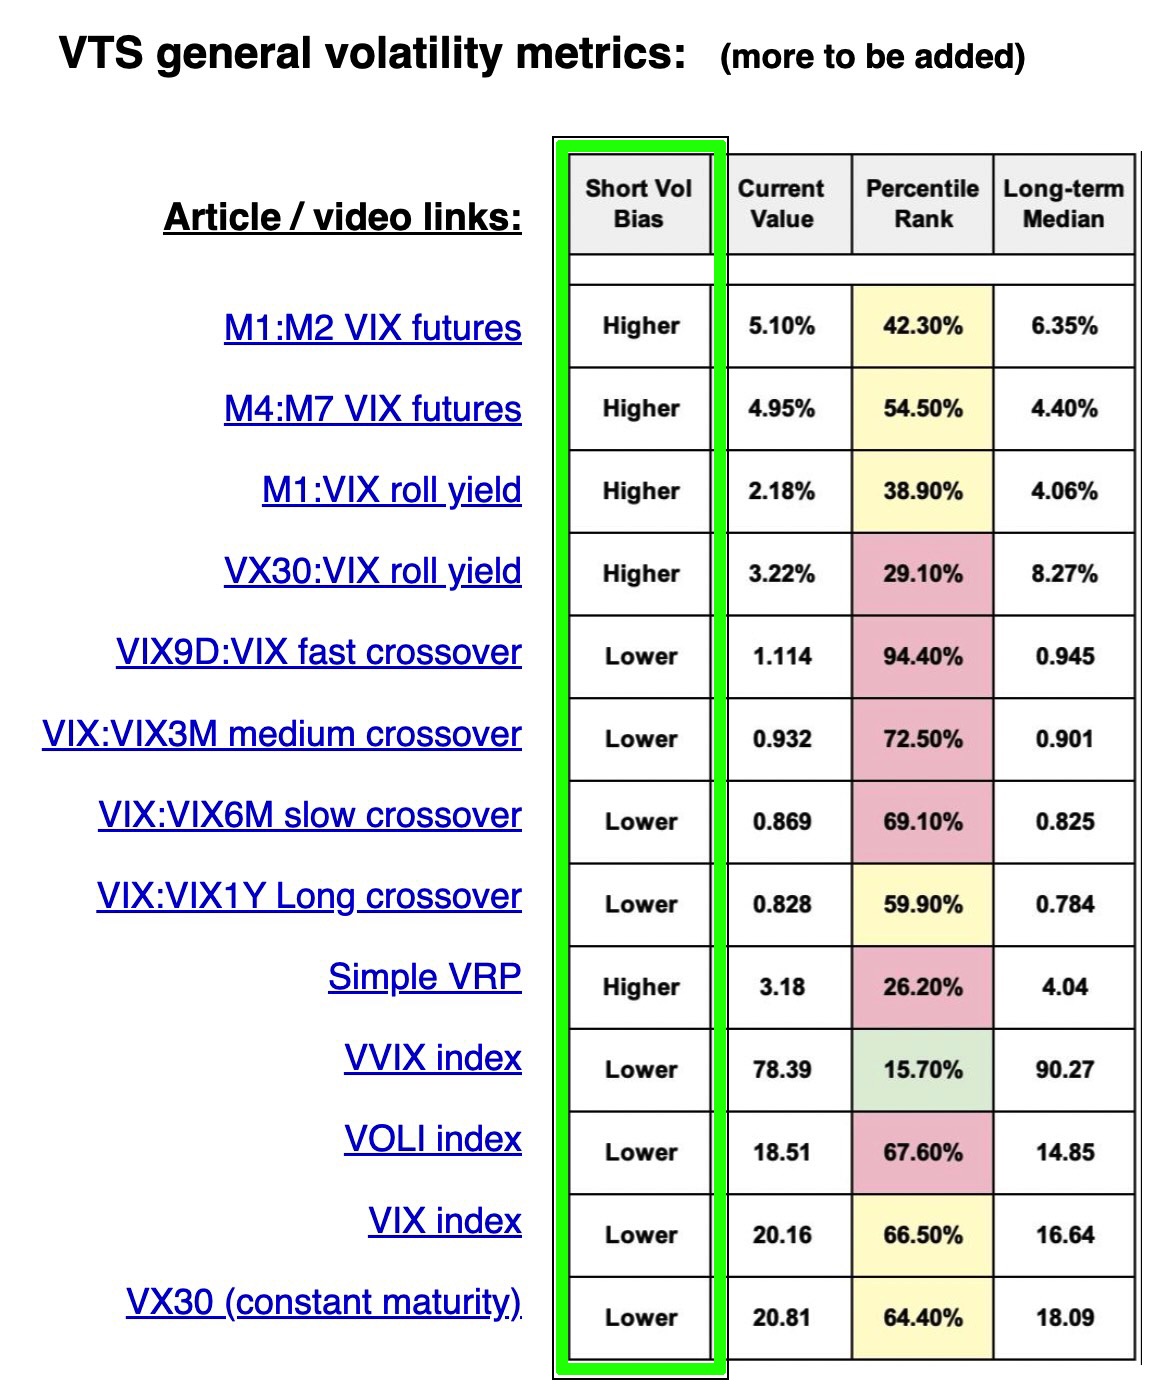
General Volatility Dashboard also has "Short Vol Bias"
So far this article was focused specifically on my own creation of a Volatility metric, the VTS Cash VIX Oscillator. However, all the other metrics in our dashboards also have a bias labelled.
It's the exact same concept. When marked higher that means short volatility is more likely to perform well when that metric is in the higher range of values.
A few additional examples:
M1:M2 VIX Futures bias: Higher
- Short Volatility positions perform better long-term with higher values of M1:M2 VIX Futures contango.
M1:VIX Roll yield bias: Higher
- Short Volatility positions perform better when the front month VIX future M1 is significantly higher than the spot VIX index.
VIX:VIX3M medium crossover bias: Lower
- Short Volatility positions perform better long-term when the 30-day VIX is trading significantly below the 3-month VIX3M.
Simple VRP bias: Higher
- Short Volatility positions perform better long-term when implied volatility IV is significantly higher than historical volatility HV. In other words, when the Volatility Risk Premium VRP is wide.
These are just guidelines, but very useful none the less...
Take Control of your Financial Future!
Profitable strategies, professional risk management, and a fantastic community atmosphere of traders from around the world.
