

What is US Treasury Yield Curve Inversion? Does it even matter?
Mar 26, 2019VTS Community,
Based on the sheer number of emails I've had on this subject in the last week or so, I think it's time to talk about... (insert scary music) the yield curve inversion!
When you hear reference to "the yield curve" it's just the different duration Treasury yields mapped on to a single chart. It's similar to the VIX futures curve which is all the monthly VIX futures prices mapped on to the same chart. Generally we're looking at the shape, or slope of these curves to gain insight, but the magnitude of the values themselves are also relevant.
US Treasury Yield Curve for Mar. 26, 2019:

And today: US Treasury Yield Curve for Jan 28, 2020:
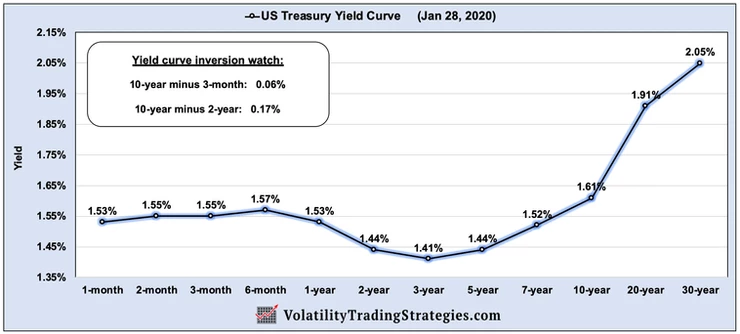
Now in a healthy market, we expect the curve to be upward sloping to the right. That means longer duration Treasury's out to the right like the 10-year to 30-year should be yielding a higher rate than shorter dated ones on the left.
And this makes sense right? With more time comes more uncertainty. There's more potential variation in inflation rates, opportunity for political changes, changing economic cycles, monetary policy decisions. For example the complete 180 this current Fed has done on rate policy, going from an expectation for a few more rate hikes just six months ago to now an expectation that there next move may be a rate cut.
With more time comes more uncertainty
Investors need to be compensated for taking on that additional risk, which is why we expect the longer dated Treasury's to pay more than the shorter dated ones.
A yield curve inversion is when shorter duration Treasury's are yielding more than longer dated ones.
* Don't forget to follow me on Twitter here
A common comparison you'll see often is the 10-year minus the 3-month. The 10-year minus the 2-year is also a popular comparison, but that hasn't inverted yet so we are currently looking at the 10-year minus the 3-month.
US 10-year minus US 3-month since 2009:
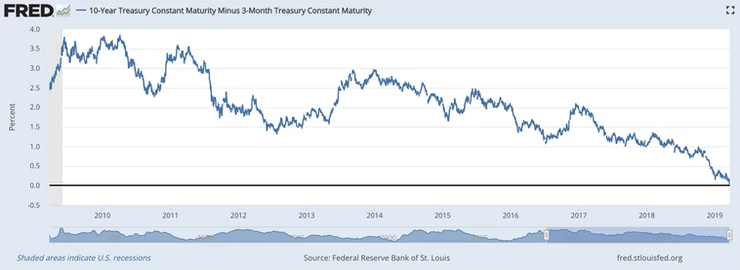
For 10 years now since the financial crisis, it has been a slow steady grind towards parity of these two common durations to the point where now the 3-month (2.46%) is yielding slightly more than the 10-year (2.43%).
This is a yield curve inversion
And to hear the financial media tell it, this is a surefire sign of an imminent recession. Time to pack it up, sell stocks, run for the hills because the pain train is coming! Well, those kinds of articles certainly do get eyeballs on the page, but is anything ever really that simple?
US 10-year minus US 2-year since 1975:
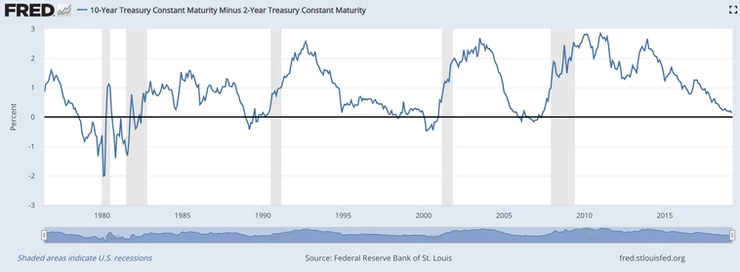
We can see that the yield curve did in fact invert before each recession. It actually worked going back at least 5 recessions so it does seem like a good indicator. However, as they say the devil is in the details and the timing of those recessions and what it actually means for asset prices is where the data gets fuzzy.
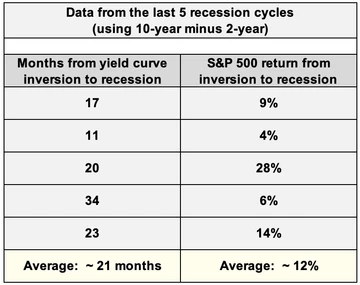
1) On average recessions started 21 months after yield curve inversion, and the last three were substantially later so there doesn't seem to be anything imminent about this signal.
2) On average the S&P 500 went up 12% from the inversion to the start of the recession. Even if we remove the obvious outlier from 1990, we're still looking at an average of about 8%. Sometimes it's hard to imagine given how elevated asset valuations are right now, but it's certainly possible that the stock market continues upward for a while after yield curve inversion.
* Don't forget to subscribe to my YouTube channel here
Conclusion:
Now I've said all of this to lead up to the conclusion that none of this matters to me, and I don't think it should matter to anyone else either. The truth is, 5 data points is a very small base to draw any meaningful insights so it's at best a rough estimate. And secondly, things may very well be different this time.
I know that phrase "this time is different" gets tossed around a lot, but financial engineering through intrusive monetary policy is at an all time high so I think it may apply. We just don't know whether the yield curve inversion is meaningful in any way this time around because of the fact that US Treasury's are not a free market anymore, very far from it in fact.
I for one will be trusting the forward looking and predictive nature of volatility metrics to guide my investing decisions going forward. I believe they are the best way to maximize the probability of being on the right side of trades. It's not always smooth, they do miss some uptrends from time to time, and it can be choppy during non trending markets. But on balance of probability, they are by far the best gauge we have of market sentiment.
There's no doubt in my mind investing is going to be increasingly more difficult as the next recession looms. Whether that's in 3 months or 3 years, I think it's reasonable to assume we're in for some choppy markets. Regardless though, one thing remains as true to me today as ever:
The key to long-term investing success is maximizing return through minimizing drawdowns. Risk management is really what it's all about.
The Fed is going to do what it's going to do. If they pause, if they cut, if they scrap their balance sheet reduction, so be it. That just means the heavily watched yield curve inversion is even less relevant. I'll be ignoring it and focusing on metrics that work.
Take Control of your Financial Future!
Profitable strategies, professional risk management, and a fantastic community atmosphere of traders from around the world.
