

Estimating Future VXX Prices for Short Volatility Trading
May 23, 2023VTS Community,
Today is part 1 of a 5 part series where we'll compare live trades for five different methods of shorting volatility. By pitting them against each other in a head to head competition we'll be able to highlight the strengths and weaknesses of each method.
The underlying security we're using to represent our short volatility trades will be Options on the iPath S&P 500 VIX Short Term Futures ETN called VXX. The five short volatility methods will be:
- Long VXX Put Option
- Long VXX Put Vertical Option Spread
- Long VXX Put Butterfly Option
- Short VXX Straddle Option
- Long SVIX
For trade #5, given that Short VXX is an unlimited loss position that also faces hard to borrow issues as well as additional borrowing fees, I'm replacing it with a Long SVIX position instead. SVIX is a -1x inverse Volatility ETF that is a direct short VIX futures position and doesn't require directly shorting an ETF. From a risk reward perspective it's a much better choice.
* For those who prefer video instead, click here for the YouTube video version
Part 1: Estimating Future VXX Prices for Targeted Short Volatility Trading
Our Options trades for this head to head competition will have an expiration date set for January 19th, 2024 which is about 8 months from now. I'm using this further dated contract so we can give the trades some time to develop and make some meaningful comparisons on how they perform in different volatility environments. Since we're targeting a specific date in the future, the first thing we need is a reasonable estimation of where the VXX will be trading in 8 months.
Why do we love trading the VXX?
Volatility ETPs don't derive their price based on supply and demand of the underlying security. That is to say, the price of VXX has nothing to do with how many people are buying or selling the VXX itself. Instead, it derives it's price based on a set methodology of rolling the front two months of VIX futures contracts.
* Click here for a detailed video explanation of VIX futures expiration cycles
For the purposes of this article, because VXX tracks the underlying ^SPVIXSTR index of continuously rolling front two month VIX futures, over longer periods of time the decay factor of the volatility ETPs is more mathematical and predictable than regular stocks and ETFs.
VXX since inception on January 29th, 2009:

The VXX officially launched on January 29th, 2009. However, since it's based entirely on a set methodology of rolling VIX futures, we can simulate the values back to the launch of VIX futures on March 26th, 2004.
It doesn't take a genius to see the long-term trend is down right?
The VXX has decayed from a split adjusted price of over 1.5 million in 2004 to less than 40$ today. It's down 99.9% since it launched. This is why in the 13 years since it's launch the VXX has become one of the go to methods of shorting volatility. Something that consistently negative will surely grab the attention of savvy traders.
Long-term VXX decay factor:
Since we're targeting trades on specific future date, it makes sense to use past historical data to estimate where our security will be on our chosen date right? Well this is a simple matter of price regression back to inception to determine the long-term decay factor of VXX
1-day VXX decay factor since March 26th, 2004

Obviously it's not a straight line down, the VIX futures are in fact an open market based on supply and demand and anything can happen from day to day. However, long-term if we smooth out the curve we can see that VXX decays -0.249% per day on average. We can also do the same and easily estimate its one week and one month decay factors as well.
5-day VXX decay factor since March 26th, 2004

21-day VXX decay factor since March 26th, 2004

Don't forget to follow me on Twitter
What will VXX be trading at on January 19th, 2024?
Now that we have the long term decay factor of VXX, we can easily use this information to estimate where it will be trading at any forward date. I've built myself a price decay calculator in Excel which would be easy enough for you to replicate if you'd like. I'll include both screenshots of the calculator so you can see what mine looks like.
I just input the 1-day decay factor (can use 5-day and 21-day as well) and I also input the price of the recent VXX reverse split at 43.77. From there I just scroll down to the day that corresponds to January 19th, 2024.

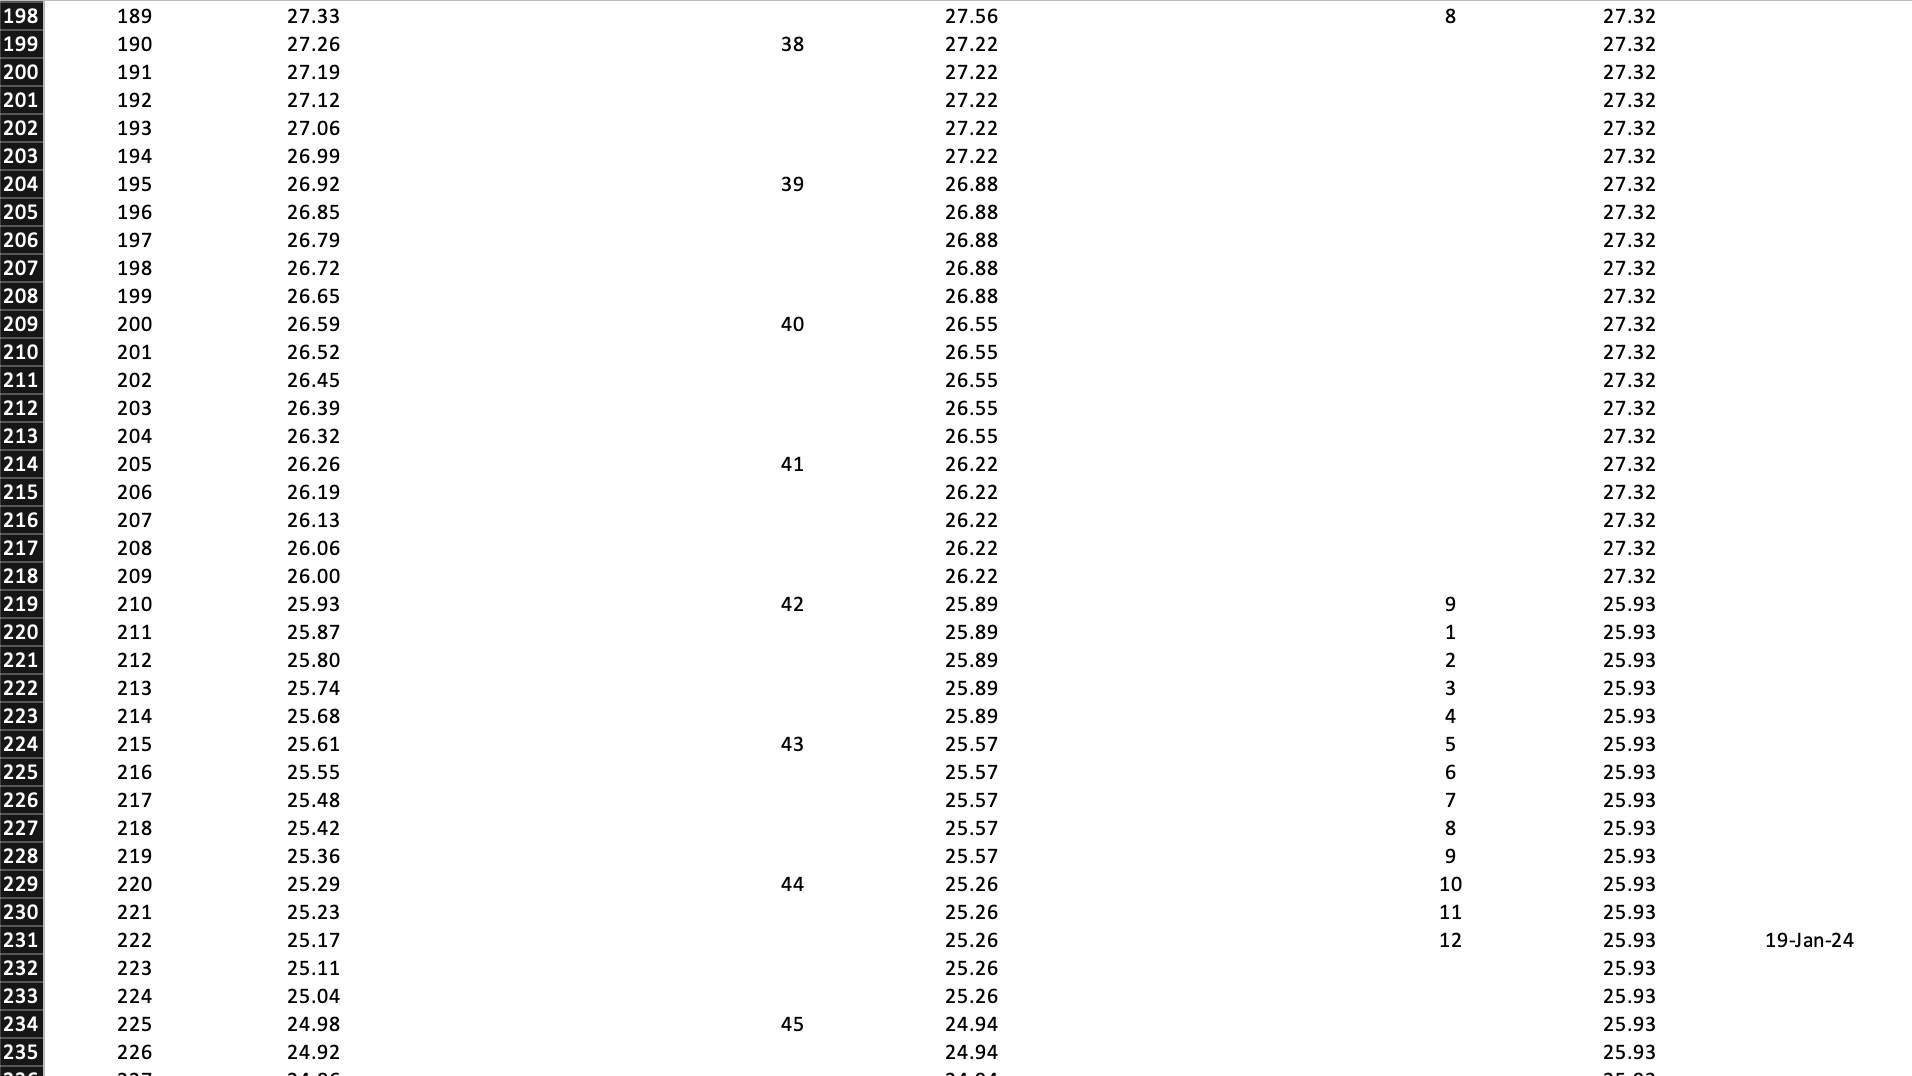
* We can estimate VXX will be trading at 25.17 on January 19th, 2024
Five Short VXX trades head to head
Now that we have a specific date and estimated price for the VXX, in part 2 of this series we can go into ThinkorSwim and execute our five live trades. We'll scale each of them so they're all using the same amount of capital and then just watch them develop over time. We'll be able to make some meaningful comparisons about the strengths and weaknesses of each.
Hopefully at the end of this series you'll isolate your favourite Short Volatility method and you can re-create this experiment and give yourself the highest probability of success with your trades.
Take Control of your Financial Future!
Profitable strategies, professional risk management, and a fantastic community atmosphere of traders from around the world.
