

4 Types of Drawdowns and Their Root Cause
Jan 21, 2022VTS Community,
With the S&P 500 down over 7% from its highs and the Nasdaq down about 11%, we also find ourselves in an uncomfortable portfolio drawdown. VTS has just passed its 10th anniversary and in the last decade I've had plenty of drawdowns. Fortunately they've been quite shallow compared to any other investing style but they do happen from time to time. Today I'm going to try to explain this specific type of drawdown we are in and its root cause because not all drawdowns happen for the same reason, they all have their own character.
Remember, every market environment is different and unfortunately no portfolio or set of strategies can succeed in all of them regardless of how good it is long-term. Sometimes the market just behaves in such a way that it violates the intended construction and you go past your comfortable risk levels. All I can do as a long-term investor is try to create a portfolio that throws out the widest net possible for catching some good uptrends, while being as protected as possible during down periods. Now granted, that is what many people would call the holy grail of investing so I'm not suggesting it's easy to do, but we just need to get it right most of the time.
1) Perfect exits with no drawdown
I've had plenty of times where I nail the exits to safety perfectly and it almost seems like I have a crystal ball or something. Believe me I don't, it's just that sometimes the volatility metrics behave in such a way that it telegraphs the move in advance and we get kicked out into safety BEFORE the trouble even starts.
Volpocalypse in 2018, we exited well before the crash
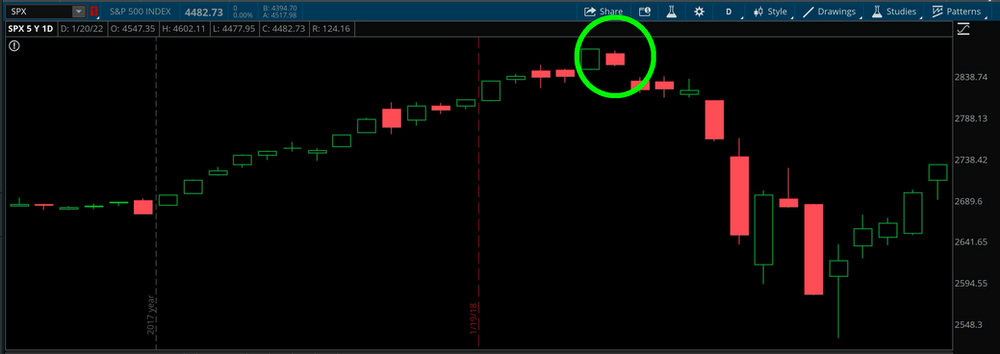
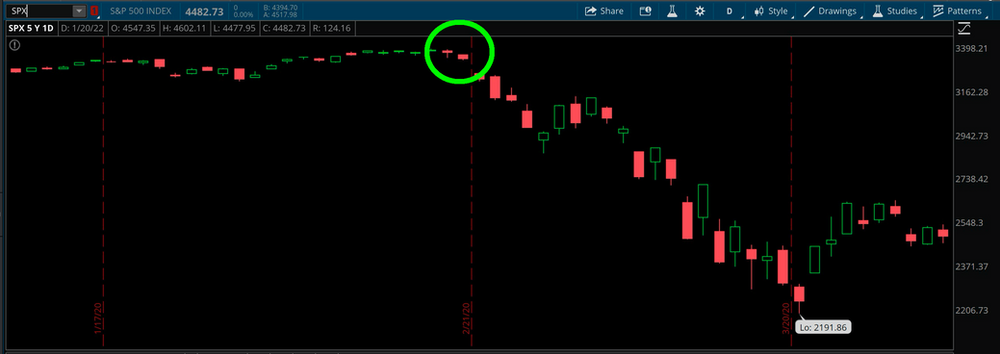
The pandemic in 2020, we were out beforehand:
2) The gut kick before exiting (small drawdown)
There are other times which are also completely acceptable to me when we don't exit before the trouble happens but instead, after a day or two of minor losses. It's sort of like a gut kick on a down day that elevates all the volatility metrics and that's the signal to exit to safety. It would be nice if it happened the day before of course, but at least it does move us to safety and sometimes that means you end up dodging a bullet.
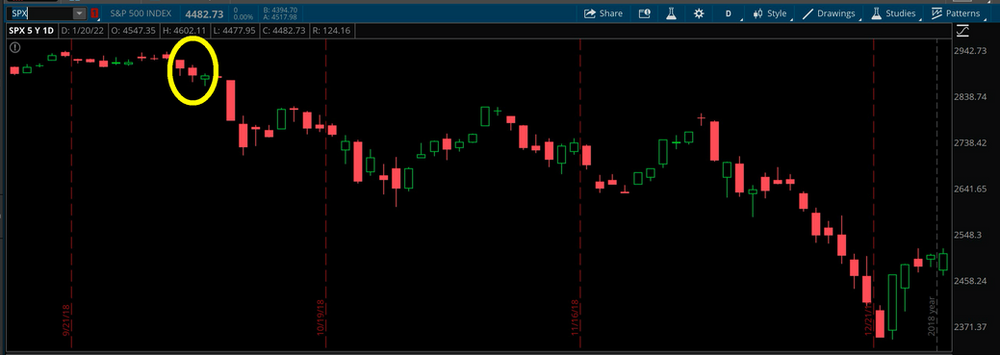
Q4 2018 was another very successful avoidance of a major stock market crash, but the day we got kicked out to safety was a down day, and then we were smooth sailing for the next 3 months.
3) Whipsaw drawdowns
I talked a lot about this in the last year because much of 2021 was what we would call a whipsaw environment. It happens when a tactical strategy moves from one signal threshold to another, only to see the new position lose money shortly afterwards. Then perhaps the signal comes to move back to the original position and again, the next day it could be down. This back and forth can lead to small amounts of capital bleed each switch of position, that if it happens a few times in a row can start to add up and land the strategy in an unexpected drawdown.
My signals get increasingly robust the longer the time horizon. The very next day the market is more or less a random walk and the signals may only be 60/40 successful the next day. After 2-3 days they might be 70/30 or 80/20. The longer the time horizon, the more correct we can get the market direction. On a next day basis though the market can do pretty much anything, and sometimes that does lead to the dreaded whipsaw with those changes of position.
4) Late response drawdowns (current situation)
This is the problematic type of exit signal and it's the one we are in now. I feel this is important to go over because as much as it pains me to say it, this won't be the last time it happens to us and we can see that in a chart later on.
Drawdown magnitude can definitely be reduced, and drawdown frequency can be minimized, but unfortunately it can't be eliminated. There is no reward without risk so it's always about maximizing efficiency, not eliminating risk.
These "late response" periods can lead to significant drawdowns before even getting the signal to move out into safety, and the majority of all drawdowns the VTS Portfolio has suffered in the 10 years since we launched are of this type.
In my opinion, tracking volatility metrics and using them to generate trade signals is by far the best way to navigate these unruly markets. Traditional technical analysis, fundamental analysis, and of course gut predictions all have inherent weaknesses that can lead to excruciating drawdowns for investors. Those methods just aren't reliable enough to allow people to stay the course long term. So for me, tracking volatility metrics and getting signals directly from there is the best method.
However, volatility metrics aren't perfect. There is such a thing as a low volatility market decline. It happens when there are no scary outlier days, no terrible news headlines, no clear identifiable root cause. Just a lower volatility decline. If it gets to a certain level then of course the warning bells will eventually go off, but sometimes that can take longer than usual.
Trying to represent them visually isn't easy but let's see if this dot plot gets the point across. Each dot represents the S&P 500 drawdown percent and the corresponding Volatility Barometer value on that same day.
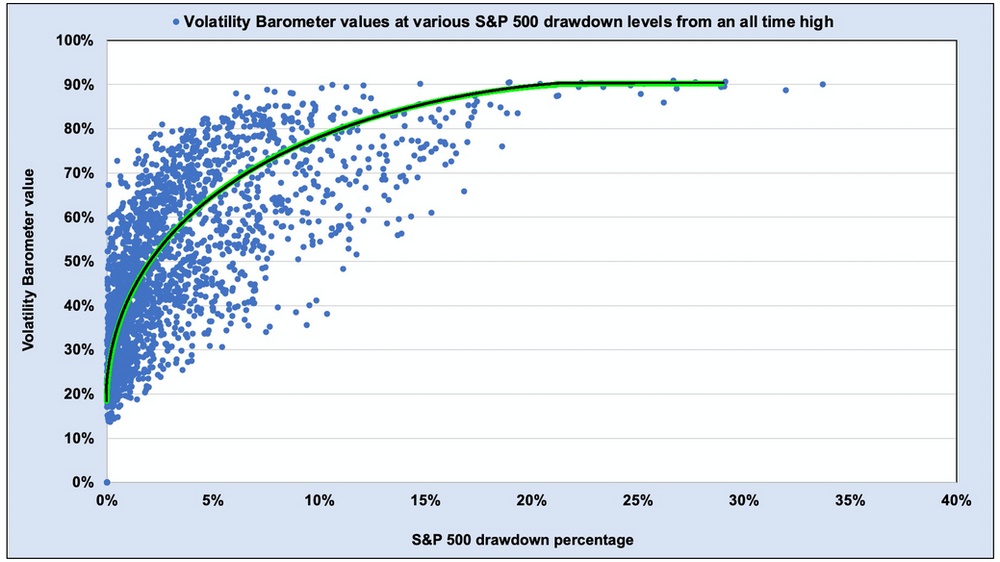
- On the x-axis (horizontal) we have the S&P 500 drawdown percentage. In the last 10 years since VTS launched the S&P 500 had a maximum drawdown of about 35% during the 2020 pandemic which you can see on the top right. For reference, it got to about 57% drawdown in the financial crisis so the dramatic stimulus measures during the pandemic likely saved the market from something much worse.
- On the y-axis (vertical) we have the VTS Volatility Barometer values on those same days.
Now it's not a perfect proxy but as a good estimation we typically have most of our portfolio moving to safety around the 65% level on the Volatility Barometer.
Finding the Goldilocks sensitivity level
Ideally what we would like to see is the larger the S&P 500 drawdown, the higher the Volatility Barometer value is. That's what we do see with the green line marking the general trend. The further the S&P 500 moves into a drawdown the higher the Volatility Barometer value gets. This is my design. I want that to be the case because it allows me to move to safety during very moderate stock market declines.
However, it can't be too sensitive because if it was I could end up eliminating periods of profit as well so it's all about the calibration. Essentially, how much of a drawdown do I want to allow my portfolio to go before the Volatility Barometer picks up on the danger and moves me to safety? That's the tight rope I have to balance.
- Not sensitive enough will lead to larger drawdowns
- Too sensitive though and it'll reduce profit potential
That's the Goldilocks reference, not too hot, not too cold :)
Sometimes volatility metrics are slow to respond:

Marked in red is the danger zone where the S&P 500 has gone into a significant drawdown but the Volatility Barometer has not breached above the 65% level. Those instances would be times when we are just sitting in mostly equity positions while the market is going down, and we haven't yet got the signal to move to safety.
Fortunately it's not very common for this to occur, but all you need is a few days of this phenomenon happening and you can find yourself in quite an uncomfortable drawdown. If it persists even just a few days past the normal exit signal it can start to add up.
While it's not common, the red zone does exist and any strategies that have net long stocks or net short volatility as potential positions are going to be losing money.
For us, we've taken a ride lower with three of our five strategies. Now the Tactical Balanced strategy has its own set of metrics that are much more sensitive and as a result it did exit to safety very early on. But Defensive Rotation, VB Threshold, and Aggressive Vol did not. It has been one of those low volatility declines and the exit signals were delayed.
What's the best defense against low volatility declines?
Only counter trend strategies can perform well during low volatility declines because they can be structured to play a different profit range. The Vol Trend strategy and our Broken Wing Butterflies are an example of this. The way they are set up, the market going down isn't the problem direction, that's not where the losses occur. For the Vol Trend strategy the losses actually occur when the market screams higher at an abnormal speed. It can still profit when stocks go up, but it is counter trend with respect to where the losses occur.
Other options strategies such as Iron Condors, Calendars, various hedging strategies, they can all be set up to act counter trend to a net long equities position and they would do much better during one of these low volatility declines.
Where's VTS Options when you need it?
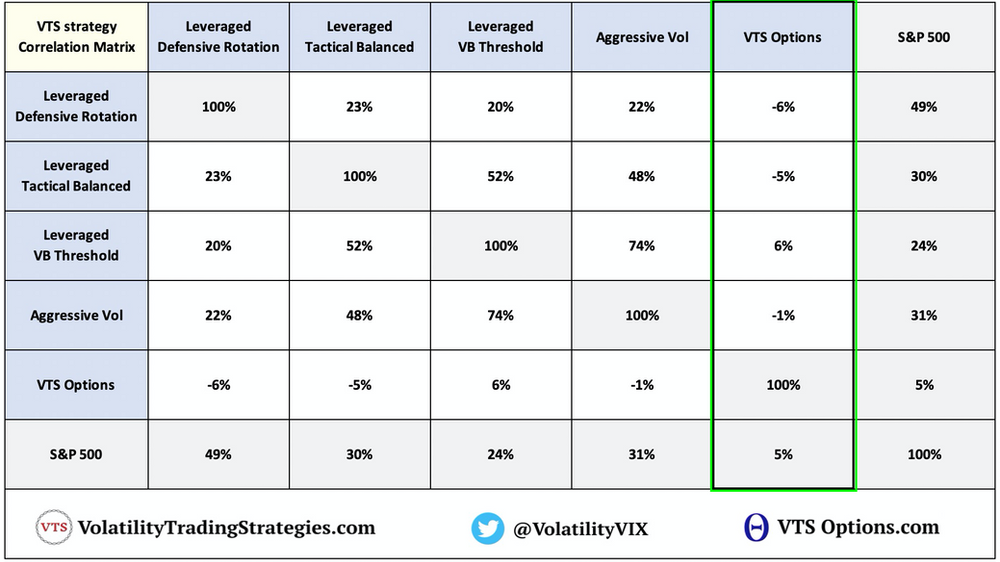
Counter trend strategies are actually what VTS Options specializes in. As we can see from the correlations of all our strategies, it's actually VTS Options that has the lowest correlation to anything else we do, as well as the lowest correlation to the S&P 500.
Apologies everyone! I really do wish VTS Options didn't have to be put on hold mid last year. Obviously hindsight is always 20/20, but VTS Options would have softened the blow these last few weeks.
I try to never talk about the business or community size, but unfortunately I'm a victim of my own success in a way. It's been such a solid 10 year stretch for the portfolio that to be honest, there's a lot of people following now. Of course I feel very blessed that is the case and I really appreciate each and every one of you. The downside though, it creates a massive email burden answering questions from such a large community.
VTS Options will make it's triumphant return soon!
Very soon I'm going to go into my cave with many sleepless nights and get VTS Options back up and running. I will make it so anyone can easily separate the two if they happen to not like options trading.
Just like before it'll be kept separate to make sure people who only want one of them isn't bothered by blogs and trade signals from the other. It'll have its own website, its own separate emails, it won't be a burden to any of you who don't want options but it'll be a nice addition for those of you who do.
Lots of work to do the next few months but I'm excited to share it when ready. Try to have a great weekend everyone!
Take Control of your Financial Future!
Profitable strategies, professional risk management, and a fantastic community atmosphere of traders from around the world.
