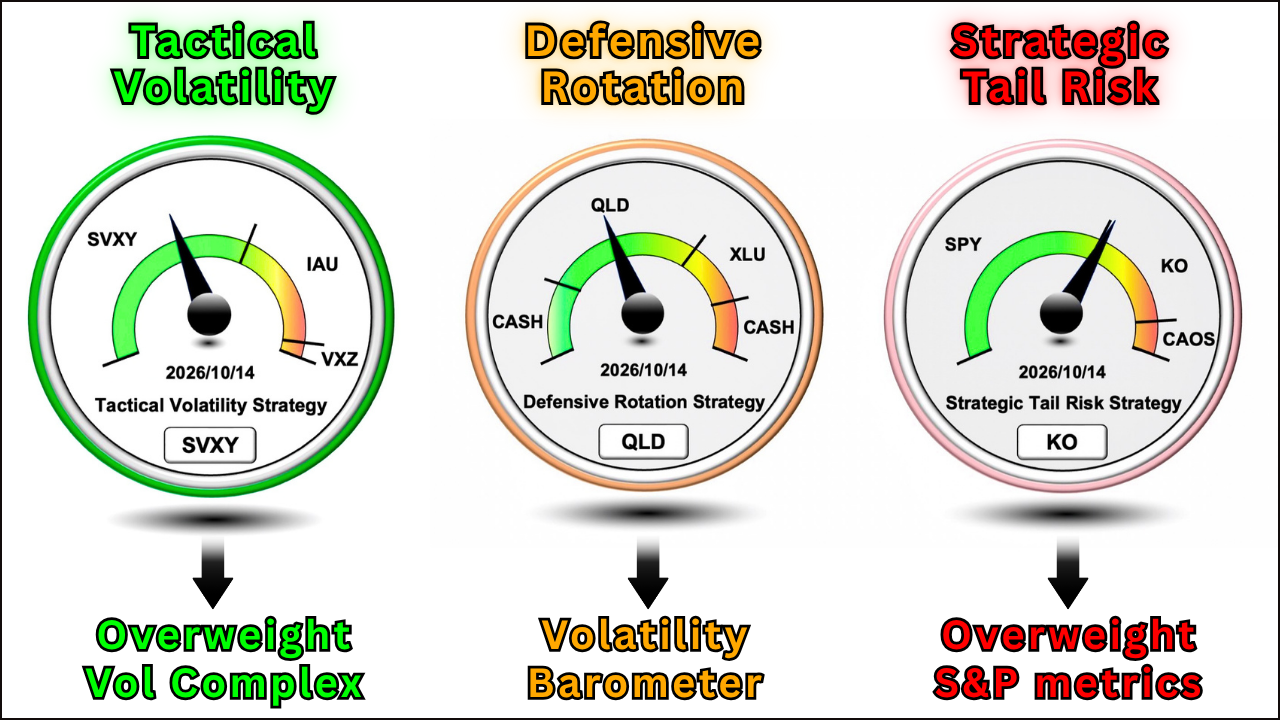
3 Point Diversification with 3 different Volatility Barometers
Oct 15, 2026
VTS Community,
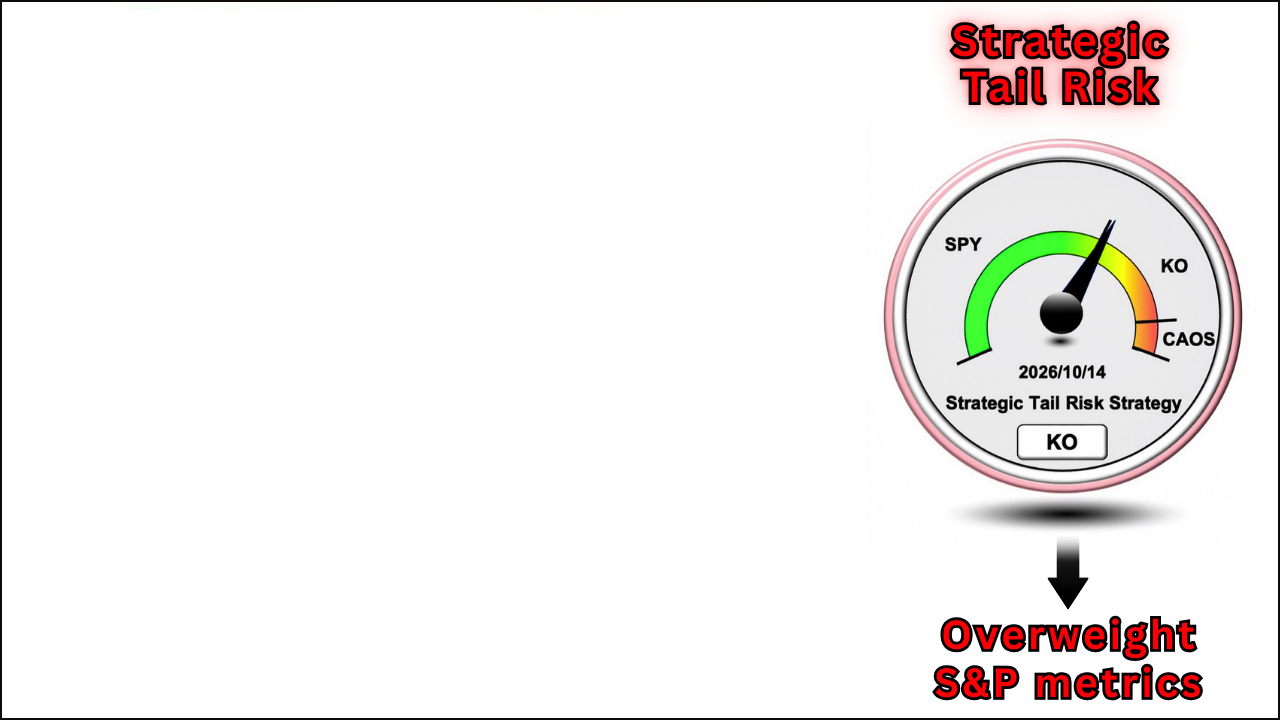
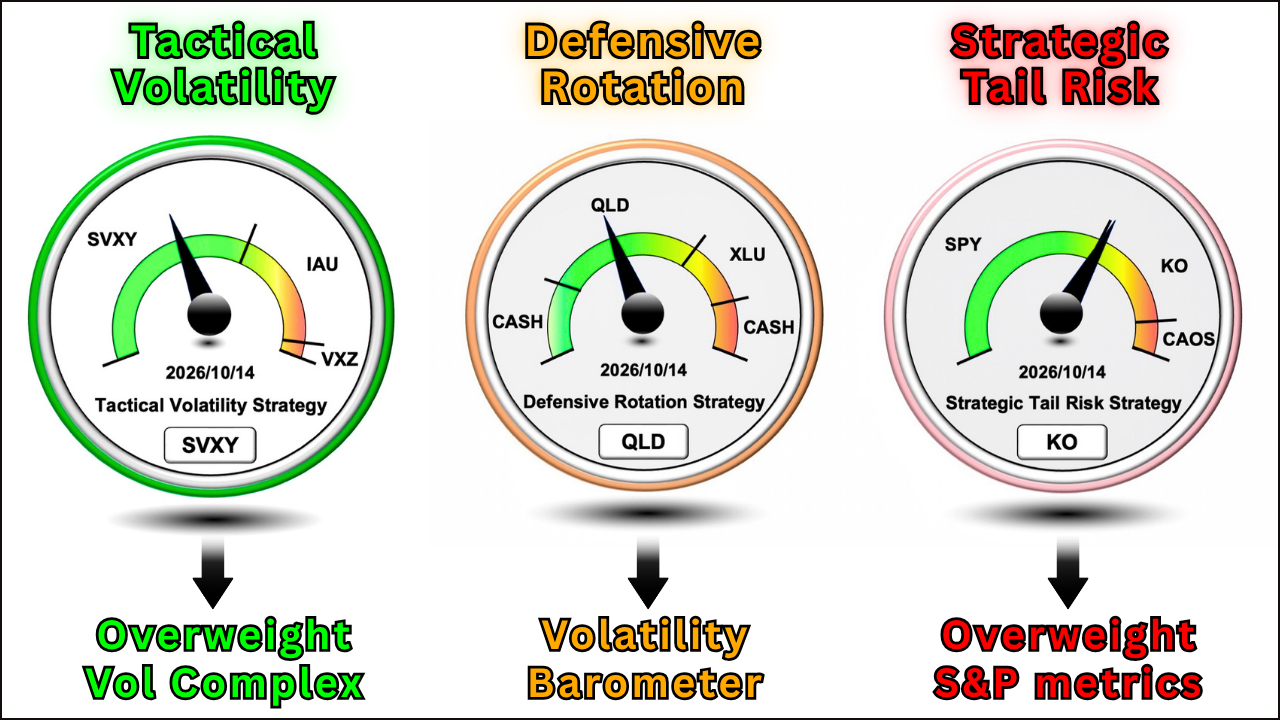
In the Strategic Tail Risk Strategy yesterday we moved from SPY into KO, but none of the other strategies changed positions. This rather odd disconnect had several of you emailing and asking why.
Diversification
Our three main tactical strategies that make up the overall Total Portfolio Solution may appear to be quite similar, but they are in fact designed to deviate from each other in a few important ways:
- Each strategy uses different Volatility metrics for trade signals
- Each strategy uses different asset classes for allocations
- Each strategy uses different thresholds for rotating positions
If they're all doing the same thing at the same time then it wouldn't be diversified and we mine as well just trade one of them right? But if all three vary in key ways then trading all three in a broad portfolio adds diversification and in the long run, increases our risk adjusted rate of return.
Different Volatility metrics for trade signals
Focusing on that first point today of different Volatility metrics, it's important to understand that while we do have a main Volatility Barometer as the best overall reading, it is actually only being used in one of the three strategies directly.
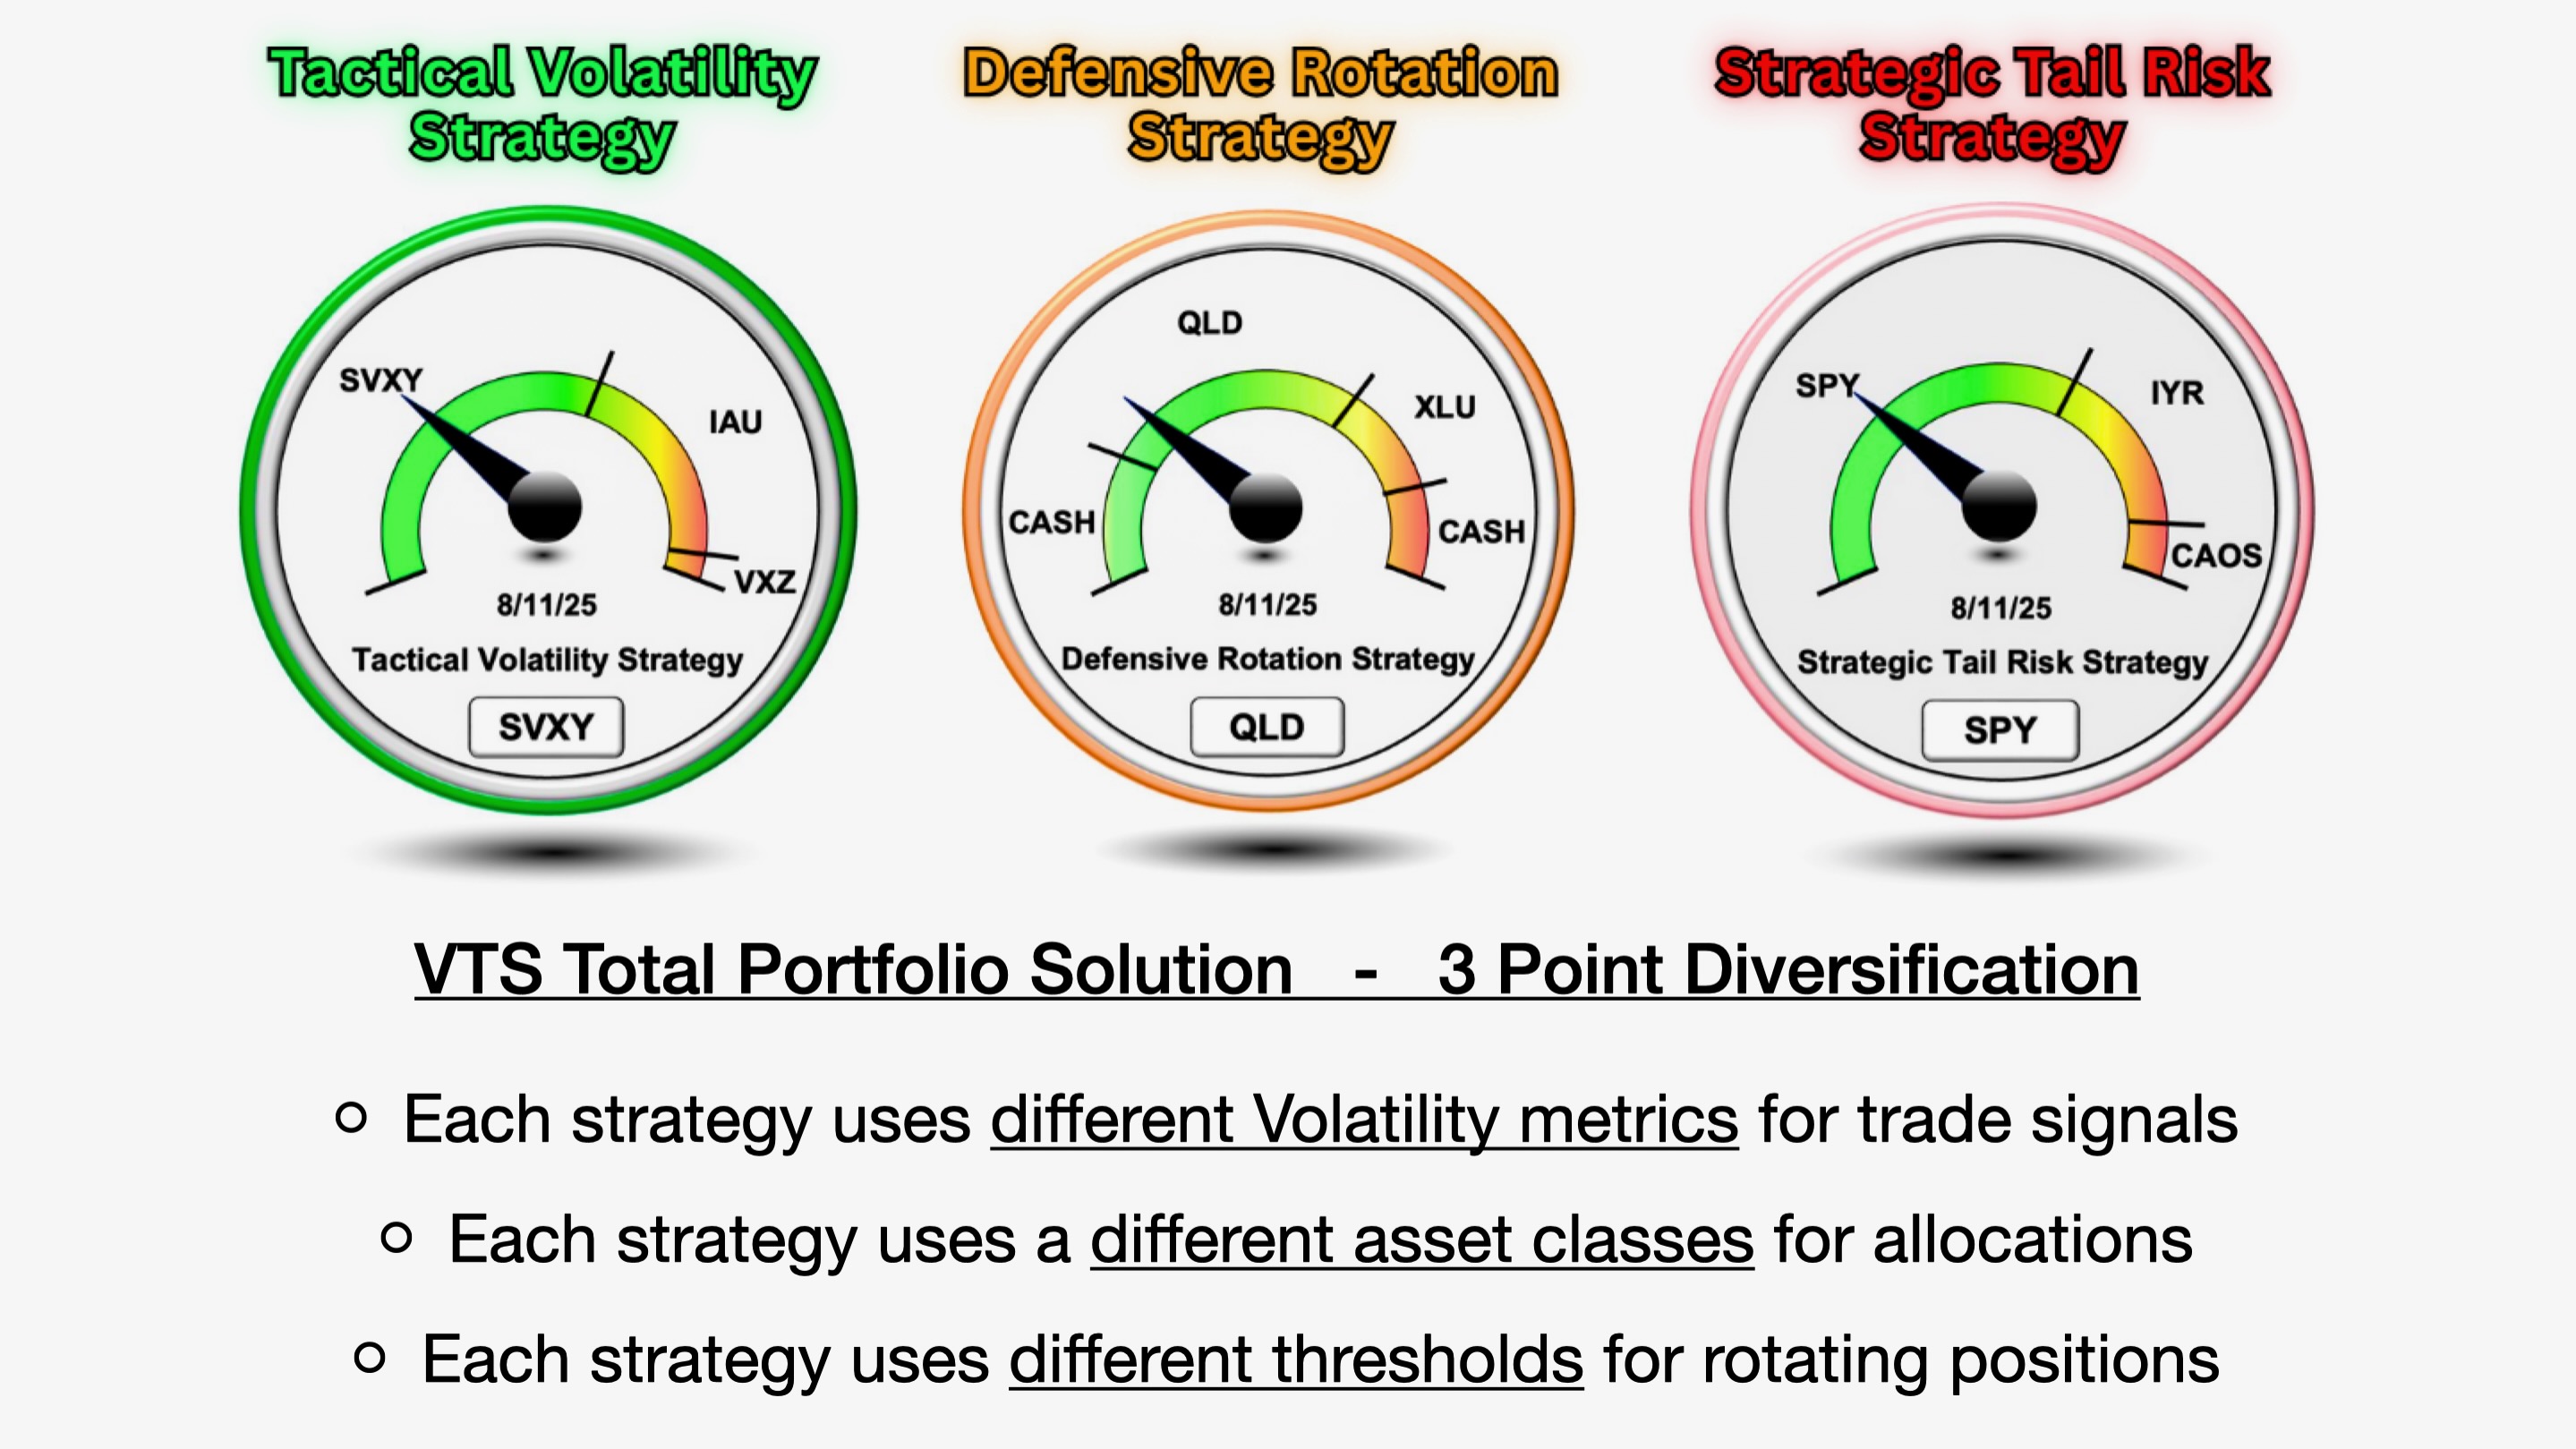
- The Defensive Rotation Strategy uses the Volatility Barometer value exactly in order to get its trade signals
If you watch the Defensive Rotation Strategy trade dial in every email it will be pointing exactly the same direction as the Volatility Barometer. The thresholds between Cash, QLD, XLU, and Cash, are all happening at the exact values corresponding to the daily Volatility Barometer.
< 20% is Cash
20% to < 66% is QLD
66% to < 85% is XLU
> 85% is Cash
So again, the Defensive Rotation Strategy uses the VTS Volatility Barometer directly
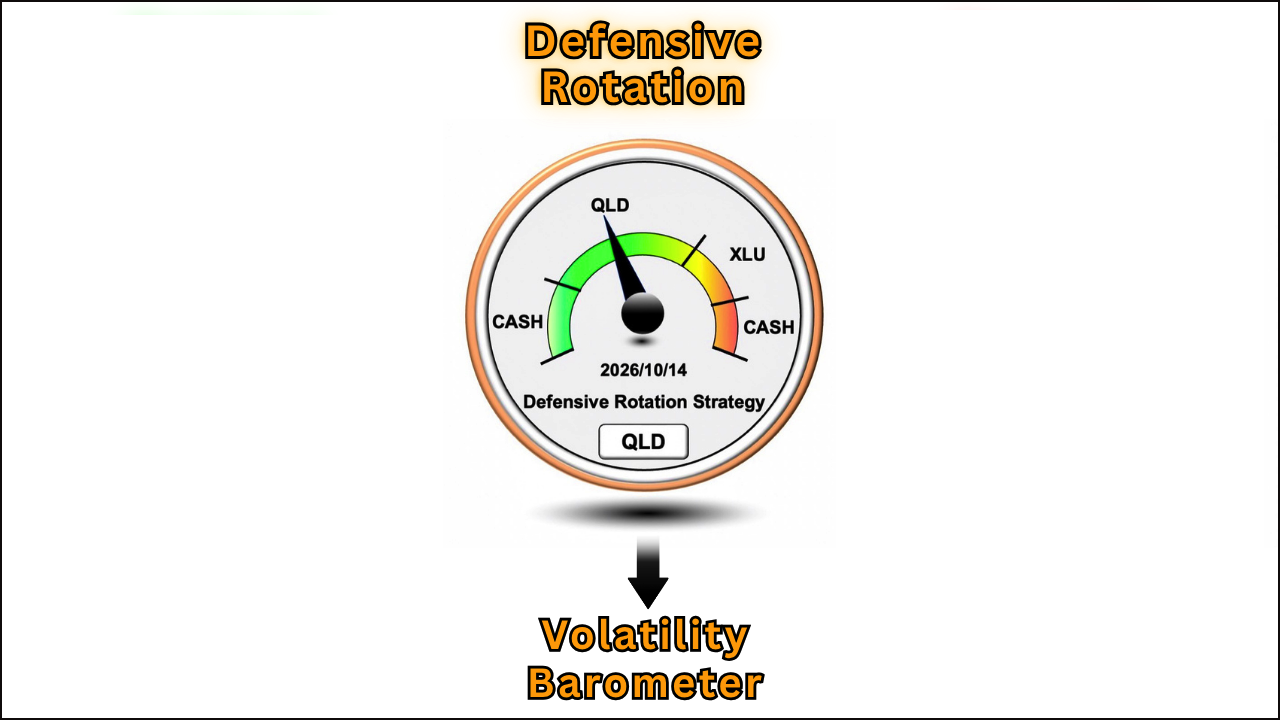
This is where we start to deviate a little, because the Tactical Volatility Strategy has its own slight variation of the Volatility Barometer. I would say it's about 75% the same, but it overweights a few of the metrics in the barometer that are more specific to the Volatility complex.
- The Tactical Volatility Strategy overweights the VIX Futures Roll Yield and a few other metrics
Because Tactical Volatility is our pure Volatility ETF strategy it makes sense to overweight the number one metric that helps us predict the future direction of those ETFs, which is roll yield.
- This reweighing of the Volatility Barometer means that during times when the Volatility complex is calmer than the broad market (which we are experiencing right now in Q3 2026) then its barometer maybe be pointing to lower levels than the other strategies.
- During times when the Volatility complex is significantly elevated in relation to the broad stock market (2nd half of 2024) then the Tactical Volatility dial may be pointing significantly higher than the other strategies.
Overall though it's a Volatility ETF strategy so we overweight to Volatility ETP related metrics
This is where the confusion was yesterday because the Strategic Tail Risk trade dial was significantly higher than the Defensive Rotation, which caused us to change position from SPY to KO, but didn't do anything in the others.
- The Strategic Tail Risk Strategy also has its own adjusted Volatility Barometer that focuses more on the mainstream stock market metrics, reduces roll yield and overweights Adjusted VIX futures as its main Volatility exposure
This can mean that during certain periods where stocks are underperforming, the trade dial may be pointing to a higher range, even though overall market Volatility may still be calm. There's also times in the market where Volatility itself is elevated and there's a lot of fear floating around, but the stock market isn't responding. That could mean the Strategic Tail Risk dial is pointing well below the other strategies.
Recently we've seen Volatility relatively low with SVXY performing quite well, but the S&P 500 is struggling. That's why Strategic trade dial is so much higher than the others.
3-point diversification
Three strategies with different Volatility metrics, different asset classes, and different threshold levels, means that the strength of trading all in the same portfolio is maximized. Sometimes all three are performing well, and other times it may only be one or two that are holding the line.
It's been a while since I've been able to say this, but to my delight it's actually the Tactical Volatility Strategy and the overall Volatility ETP complex that is behaving the best. I'm not sure it's a full return to the glory days of the "Short Vol" trade, but it is nice to see the out-performer recently is SVXY.
Take Control of your Financial Future!
Profitable strategies, professional risk management, and a fantastic community atmosphere of traders from around the world.