

Volatility Metric: VTS Extreme Put/Call Ratio
Dec 17, 2019VTS Volatility Dashboard #16 - VTS Extreme Put/Call Ratio
What is a Put/Call ratio?
In general put/call ratios are used to gauge the sentiment in the market. Now you'll definitely hear varying opinions as to how useful they are. Some traders swear by them, and others think they are complete nonsense. For me I'm more on the useful side, but as you know I'm a real data miner so I've found plenty of awesome ways to use the VTS Extreme Put/Call Ratio to make money. My win rate on trades based on this metric is quite high, I'll get into that later. When I hear people say put/call ratios aren't useful, I always think to myself, that's probably because they haven't put the work in to really unpack them and find clever ways to use them. They certainly are meaningful in my trading, especially options trading.
Now one of the criticisms of put/call ratios (and to be honest a valid one) is that it's never possible to nail down the exact purpose behind all the options activity in the market. Sometimes they are direct speculation, other times they are hedges, and yet other times they can be just a small part of a broader strategy. With so many ways that options are being used, naturally there's some grey area which is why I only use extreme readings to influence my trading, hence the name VTS "Extreme" Put/Call Ratio.
So this is all just speaking in averages, but in general:
- Put options are bought when traders have a negative outlook on the underlying, or are hedging against possible downside.
- Call options are bought when traders have a positive outlook on the underlying, or are speculating on possible upside.
A put/call ratio then is simply the ratio of puts to calls. High numbers are when puts outnumber the calls, and low values are when calls outnumber the puts.
There's several put/call ratios out there people can reference for equities, indexes, the VIX index itself, there are many. For me, I like to look at more comprehensive readings and that's what my VTS Extreme Put/Call Ratio is based on.
VTS Extreme Put/Call Ratio since March 2004:
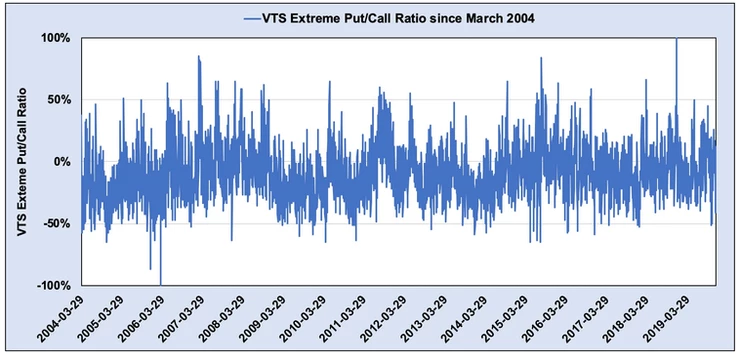
The VTS Extreme Put/Call Ratio indicator ranges from -100% to +100% depending on the current level. However, the vast majority of the time it bounces around in a range between +50% and -50%. Again speaking generally:
- Strong positive readings when puts outnumber calls may indicate extreme bearish sentiment
- Strong negative readings when calls outnumber puts may indicate extreme bullish sentiment
Most of the VTS Volatility Dashboard metrics are trend following indicators, but the difference here is, I use the VTS Extreme Put/Call Ratio as a contrarian indicator. This means that when it's showing extreme bearish or bullish sentiment, I see that as an opportunity to take the opposite side of the trade.
There are two values that will always be shown in the VTS Volatility Dashboard. The first is the actual value of the VTS Extreme Put/Call Ratio indicator. That number ranges from -100% to +100%. The second is that values percentile rank compared to all previous values going back to March 2004. So in the daily emails the VTS Community will see it shown like this (metric #16 highlighted in green)
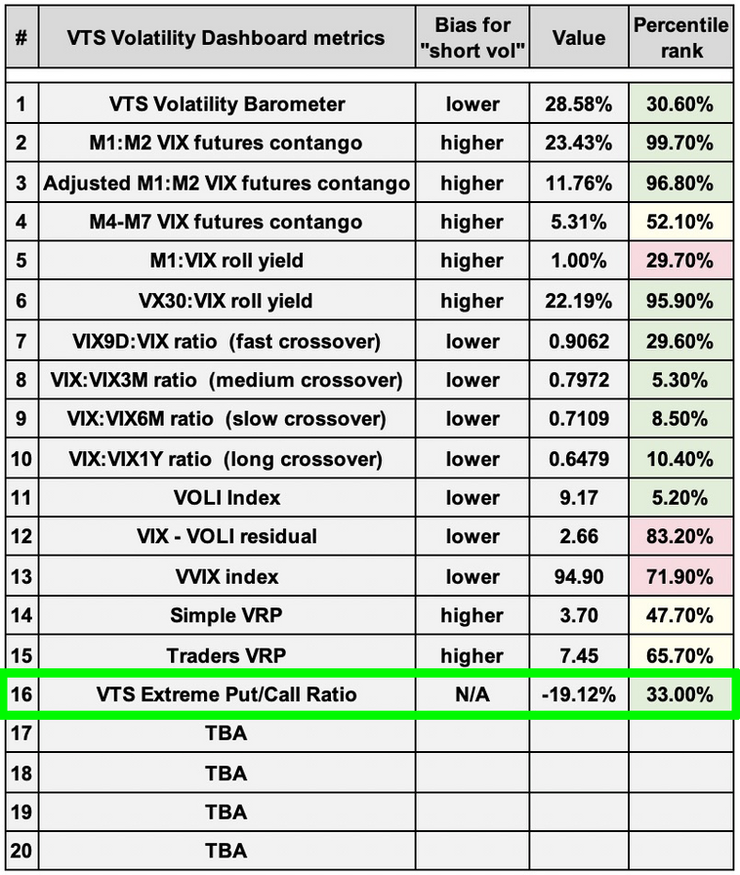
There is no "short vol" bias because it is being used as a contrarian indicator, not a trend following one. Now it is easier to use the percentile rank column so in the future when I talk about this indicator, I will almost always be talking about the percentile rank.
* Remember percentiles range from 0% to 100%. 0% being the lowest level ever, and 100% being the highest level ever, over the entire measurement period.
I'm a trader that focuses purely on the math. Nothing I do is based on opinion or gut feelings about anything. If I can't prove it with historical data I don't use it. If it can't be modelled in a formula then I don't use it.
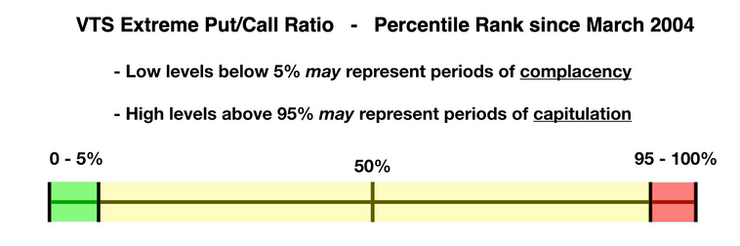
So let me prove with numbers why I have confidence in this indicator. Since January 2018 there have been 27 trading days where the VTS Extreme Put/Call Ratio was above the 95th percentile. As the table above shows, this is an extreme level in the red range and may represent a period where traders have capitulated and markets may be ready to recover.
To test this hypothesis, here's where the VXX and the SPX was trading 1 month (20 trading days) after the extreme reading. And I've grouped them together if the >95% reading was within 5 trading days of another extreme reading, meaning they can be grouped as the same extreme period:
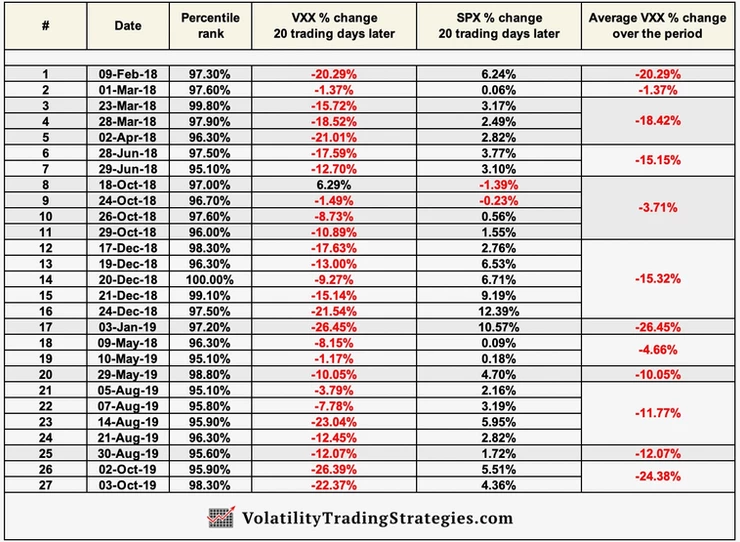
Look at the VXX column. Only once out of 27 occurrences was the VXX higher 20 trading days later. And if we look at the far right column for the groupings, 12 out of 12 groups of extreme readings lead to a lower VXX reading one month later.
I'm sure you can think of many ways to capitalize on this information and i'm looking forward to hearing from some of you more active traders in the VTS Community. Feel free to share your thoughts on this.
One way though, if a trader entered a 1 month at the money Vertical spread on the day the VTS Extreme Put/Call Ratio was above the 95th percentile, they would have won 26 out of 27 trades. I hope we can agree, that's above statistical chance :)
The VTS Extreme Put/Call Ratio indicator has been added to the VTS Volatility Dashboard. Absorb the information, think about possible ways it can be used, test out your theories, apply it to your other trading strategies, and as always I'm here to help so if you need some clarification or guidance I'm just an email away!
Take Control of your Financial Future!
Profitable strategies, professional risk management, and a fantastic community atmosphere of traders from around the world.
