

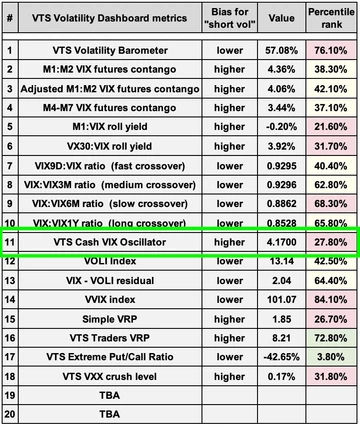
Volatility Metric: VTS Cash VIX Oscillator
Feb 18, 2020I hope everyone had a great holiday long weekend and are ready to get back into it. As promised I'm going to go over a new addition to the VTS Volatility Dashboard. You can see it there added in as metric #11:
VTS Cash VIX Oscillator
VTS community members will be well aware by now of my love for the cash VIX term structure and the wealth of information that can be gleaned from it. Just to review, there are 5 different indexes that have "VIX style" calculations based off various strips of S&P 500 options of different expiration time frames. VIX9D - 9-day forward implied volatility VIX - 30-day forward implied volatility VIX3M - 3-month forward implied volatility VIX6M - 6-month forward implied volatility VIX1Y - 1-year forward implied volatility
Cash VIX term structure today Feb 18, 2020:
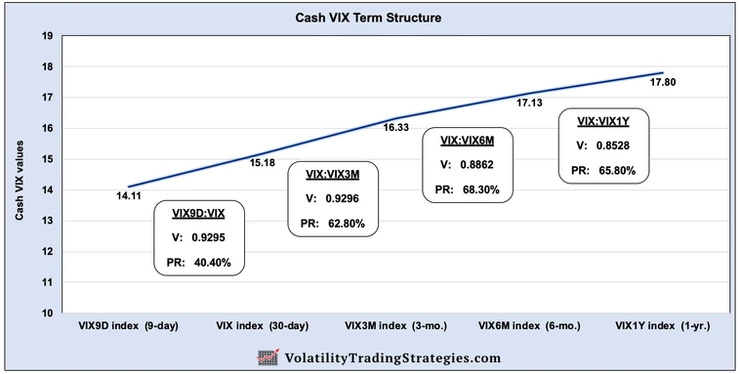
All of these indexes are measuring the same thing, just over different time frames. They are the markets expectation of future price movements in the S&P 500, based on S&P 500 options activity. So I've come up with some simple indicators that show the relative value of them compared to the baseline VIX index. Dashboard metric #7: VIX9D:VIX fast crossover Dashboard metric #8: VIX:VIX3M medium crossover Dashboard metric #9: VIX:VIX6M slow crossover Dashboard metric #10: VIX:VIX1Y long crossover These indicators can be used very effectively as actionable trade signals depending on the time frame of the trader and the strategy. For example) If a trader wanted to exit positions only when the volatility markets are breaking down significantly, they may only move to safety when the VIX:VIX6M slow crossover goes over 1. If however they wanted to be out of stocks the moment the market is showing elevated fear, they could exit to safety when the faster reacting VIX9D:VIX fast crossover goes over 1. Or perhaps a trader wants to short volatility when the VIX:VIX3M medium crossover dips below a certain level. The possibilities are vast, and I share these indicators because I know how useful they have been in my own trading and I'm hopeful you will find them equally so. Today I'm adding an indicator I have that combines all the time various time frames from 9 days to 1 year, into a single reading. This will be for those of you who prefer to just view the cash VIX term structure as a single metric. Instead of breaking it down into different time frames, think of this metric as an overall market gauge or a "red light green light" type of indicator.
Don't forget to follow me on Twitter
Just like the other Volatility Dashboard metrics, I will present it in 3 columns:
1) "Short Vol" bias, higher. This shows the ideal direction for the indicator that provides a general tailwind for the short vol trade. In this case, higher values for the VTS Cash VIX Oscillator are more advantageous to shorting volatility, and lower values are when the market is showing significant concern/fear.
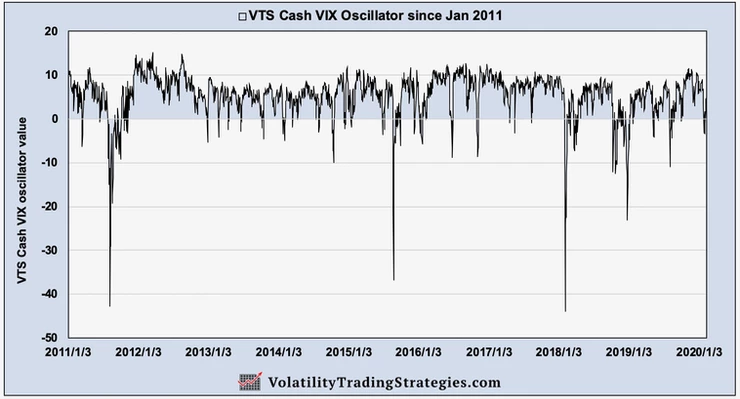
2) Absolute value. This is not normalized so there's no cap to how high or low the absolutely value can be. Since January 2011 it's been as high as 15.28 (Mar 16, 2012) and as low as -43.98 (Feb 5, 2018)
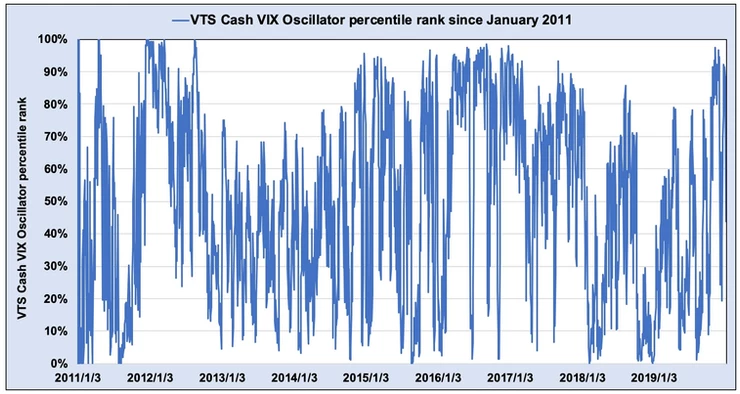
3) Percentile rank. I often like to view metrics as a percentile rank because it's easier to see where the value is in terms of the past. Percentile rank goes from 0% to 100% and will show at a quick glance where the current value ranks compared to all other values back to January 2011. So values above 70% for example reflect a calm and stable market, where as values below 30% for example reflect that the current reading is low and perhaps a period of elevated market fear.
Here's what you really want to know: How effective has the indicator been in avoiding market drawdowns in the past?
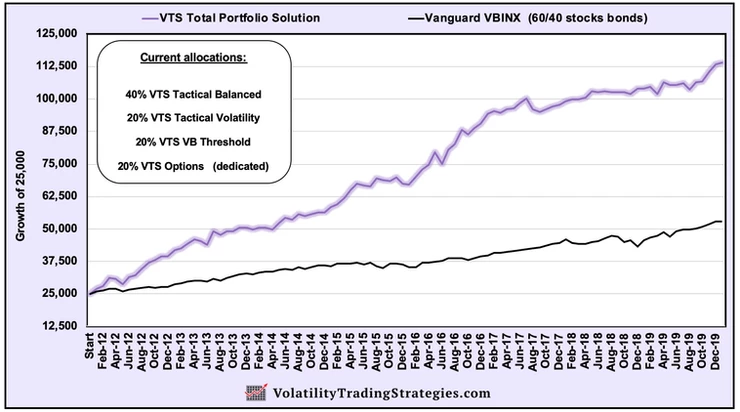
My work at Volatility Trading Strategies is not of the "go big or go home" variety. I am hyper focused on giving people the best long term investment experience possible. That means BOTH a high rate of return that crushes the market in the long term, and reduced drawdowns during difficult market periods. VTS Total Portfolio Solution since inception:
Let me show you how this Cash VIX Oscillator could have been used to avoid the biggest market crashes of the last 5 years. August 2015 - December 2015:
The Cash VIX Oscillator dropped below the 30th percentile on Aug 19th, 2015 which may have indicated a good time to move to safety. Where on the S&P 500 was August 19th 2015 you may ask?
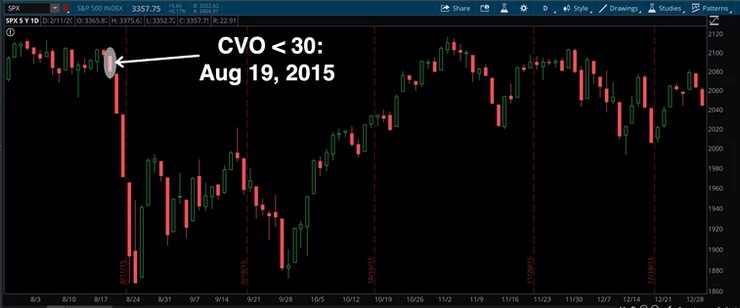
A trader could have avoided the market crash in 2015 by paying attention to this indicator. By the way, my VTS Total Portfolio Solution did avoid it. The S&P started crashing in August and didn't bottom until February 2016. My Total Portfolio solution was profitable and up a few percent over that same time frame. January and February 2018: "Volpocalypse"
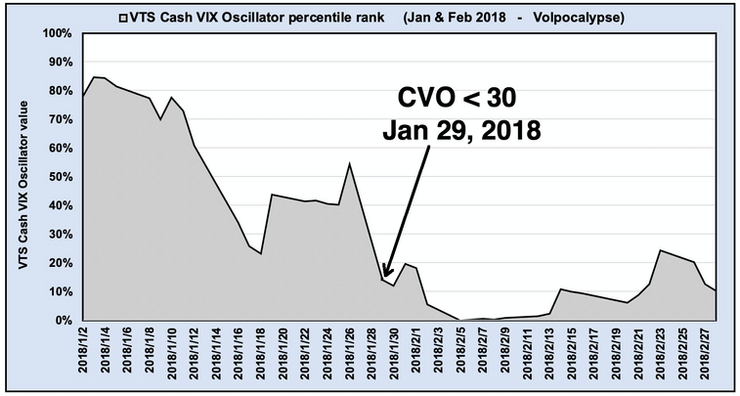
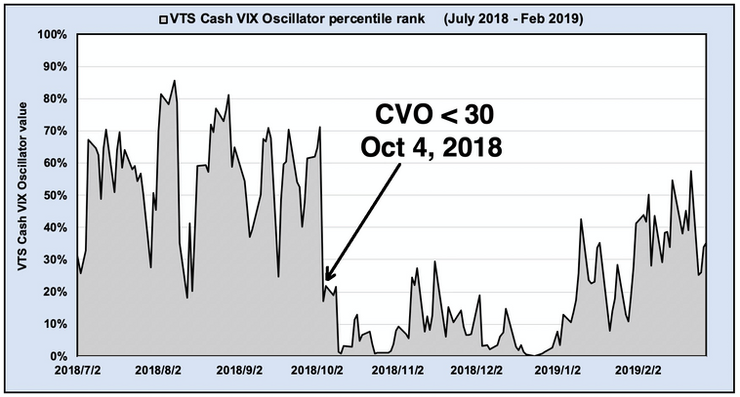
The Cash VIX Oscillator dropped below the 30th percentile on the 29th of January, well in time to avoid any damage the following couple weeks of Volpocalypse.
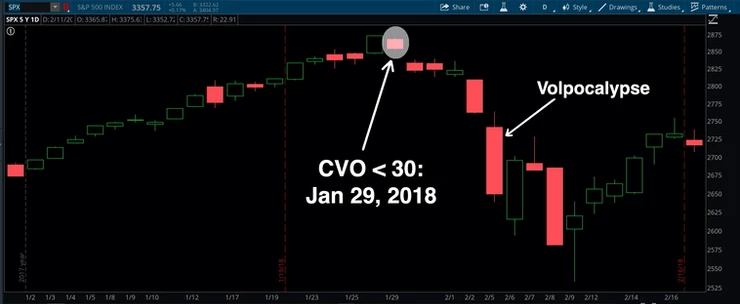
Because I've dedicated a good portion of my portfolio over the last 15 years to "shorting volatility," people always ask me the natural follow up question: How much did you lose during Volpocalypse? My answer, nothing. All of my volatility strategies were safely in cash a week before it happened. Q4 2018 (the largest S&P crash since the financial crisis):
Same story here, lower values represent periods of elevated volatility and perhaps not the greatest time to be holding bullish market positions, which I wasn't.
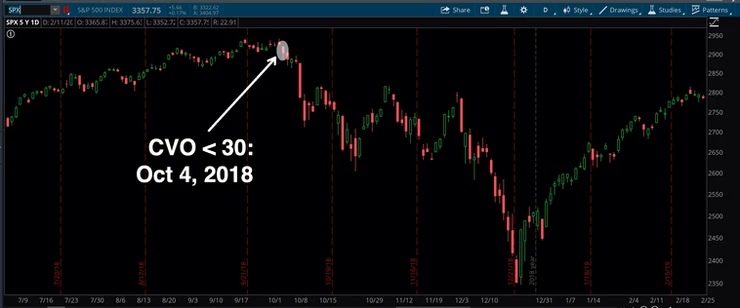
The VTS Total Portfolio Solution was profitable during Q4 2018 as well! The S&P crashed -20%, but here at VTS we slept like babies and made a little money during the crash. Risk management is what it's all about.
Conclusion:
Navigating the market in the safest way possible is what I've dedicated my career to. As I always say, everyone and their dog can make money when the market cooperates. That's not investing skill, that's just what happens in a bull market.
Everyone is a genius in a bull market
But what really separates the successful long term investors from the crowd is how they handle difficult market periods. Being able to identify periods of elevated risk and act on them by moving to safety positions before the trouble escalates. The VTS Cash VIX Oscillator is one of many indicators I use to do just that and it's updated and shared with the VTS Community right before I send out my daily email. On its own it's a very effective guide for drawdown avoidance. Taken as a whole with the rest of the volatility dashboard metrics, they are what's going to keep me safe and profitable for many years to come and I hope you find clever ways to utilize these metrics I share.
Take Control of your Financial Future!
Profitable strategies, professional risk management, and a fantastic community atmosphere of traders from around the world.
