

Part 1 - 5 Volatility Ranges - Our Expected Portfolio Positions During Each
Feb 16, 2022VTS Community,
The vast majority of the investment world is what we would consider buy and hold investors. Now it's hard to put an exact number on it but if I had to make my best guess, I'd say 90% or so of investors would fall into that category. That means they (or their advisor) constructs the portfolio by allocating capital to various asset classes in the perceived ideal allocations and it's held for the long-term. Now there may be occasional rebalancing and allocation size adjustments, but overall it's just buy and hold and they hope for the best. Any quick Google search will reveal a wide array of buy and hold portfolio's put forward as ideal allocations. They may look good in marketing material, but in my opinion this is not how to construct a successful portfolio.
We, the VTS Community are not buy and hold investors. I could write a book on all the reasons why (should I?) but one of the more obvious reasons I don't endorse the buy and hold investing style is:
Every asset class has periods where it's expected to perform well, and periods where it most likely won't. Why would investors want to maintain the same allocations of asset classes during low, medium, and high volatility periods?
Clearly the performance will vary wildly in those different ranges right? As an example, it doesn't make any sense for investors to hold the same allocation to the S&P 500 when VIX futures are in strong M1:M2 contango vs when they are in backwardation does it? Even a basic understanding of the volatility complex will be enough to know that the risk to equities is substantially higher during backwardation, and investors would be wise to reduce exposure at that point.
This is why our VTS Total Portfolio Solution is made up entirely of tactical strategies designed to allocate to asset classes only during the times they have the highest probability of success, and we reduce exposure when they have a headwind.
- I'll gladly hold equities (and even take leveraged positions) when volatility is in mid to low ranges, but I don't want to hold equities at all when volatility is high.
- I don't want anything to do with buy and hold on gold, but I will gladly hold an allocation of GLD gold during times of either very high or very low market volatility.
- Long Volatility by very design is a depreciating asset and holding a constant rolling position is a losing strategy long term. Again though, under the right conditions of elevated market volatility I have no problem being long volatility.
I'm not suggesting it's easy, but with some effort we can determine when the most likely periods of success and failure will be for all the various asset classes. Since I have done the work and studied markets for over 15 years, why on earth would I buy and hold as if all environments are equal when they most certainly aren't?
The tactical nature of VTS strategies
Our current Total Portfolio Solution (excluding VTS Options) is made up of 4 strategies with equal 25% weighting.
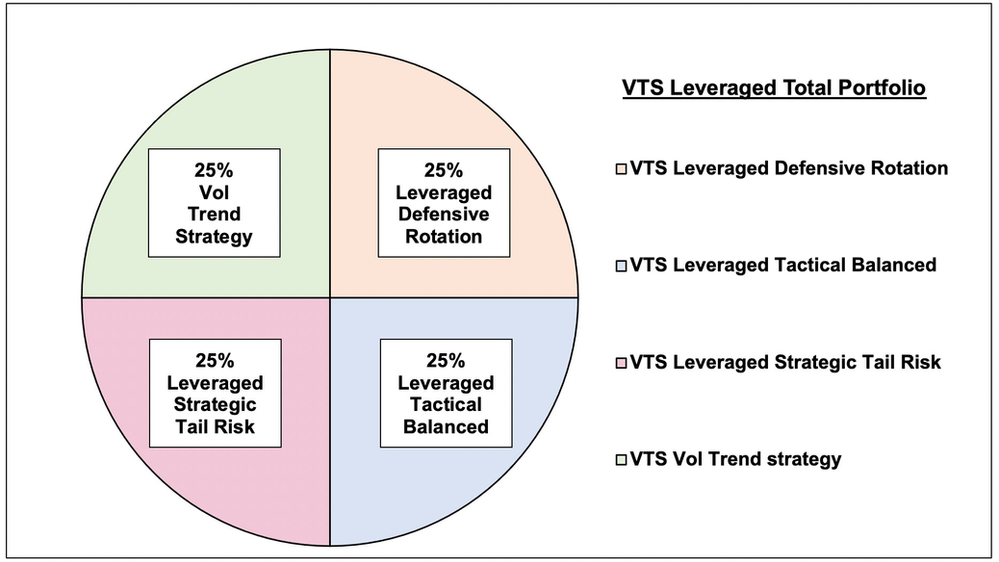
The key though is that each 25% allocation is an independent tactical strategy on its own, set up to hold different assets depending on the current market environment and a wide range of volatility metrics. Stocks, bonds, gold, real estate, utilities, long volatility, VXX / UVXY butterfly options, and cash. Not all environments are equal, and each of those classes will have times when they are well suited, and times when they aren't. You don't just hold them all the time and hope for the best, we need to be strategic with our decisions.
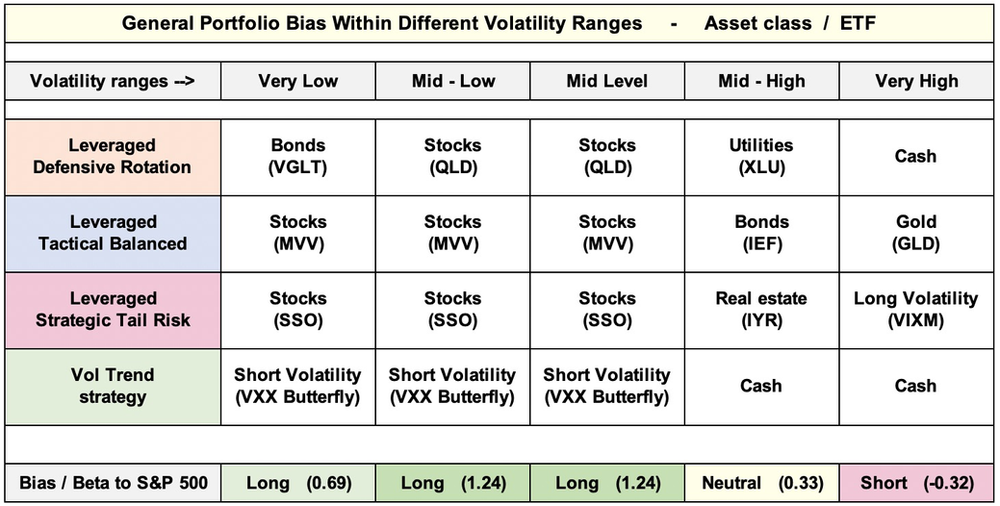
Volatility is a wide spectrum and there are no clean breaks between different levels, but for the purposes of this article, let's divide the market into 5 different volatility ranges and show how our portfolio will likely be allocated within each range.
Note, I don't want this article to be too long so we'll ignore the Beta values and what those mean today, and tomorrow we'll continue on with part 2 where I will dive into the specifics of Beta : S&P 500
That table above shows that our portfolio is substantially different based on the level of market volatility. There are times when it makes sense to be aggressive with our net long equity exposure and even take on leveraged positions. There are also times when it's too risky and the prudent play is to reduce exposure and cycle into safety positions.
1) Very Low Volatility:
- Stocks, Short Vol, Bonds, net long SPX exposure
Extended periods of very low volatility are quite rare, but for the best example we can look to mid 2016 through the end of 2017. For 18 months the VIX was mostly range bound from 10-12 and had a record setting number of days of closing below 10.
While low volatility should not be taken as a contrarian signal that it will somehow end soon, historically it's actually not the best environment for equities. It doesn't mean a crash is coming, but it does sometimes mean equities are running on fumes so a slight reduction in exposure is warranted. In this range we add some bond exposure and skew our VXX butterflies to be more Delta positive than they normally are.
2) Mid - Low Volatility:
- Stocks and Short Vol, strongly net long SPX exposure
Historically, mid to low volatility is the best period for equities and for the short volatility trade. 2011 through 2017 had several extended periods in this range and the VTS strategies took advantage of them. Those periods are opportunities for the savvy volatility trader to substantially outperform the stock market.
3) Mid Level Volatility:
- Stocks and Short Vol, strongly net long SPX exposure
Mid level volatility in the 40 - 60% range is also historically a very advantageous time to be aggressive. We do have to keep one foot near the exit door though just in case we start entering the higher volatility ranges, but we're still ok here to go fully leveraged long equities and short vol.
4) Mid - High Volatility:
- Utilities, Bonds, Real estate, cash, neutral SPX exposure
Anything in the 60 - 80% range isn't a full on red flag and it's still too early at this point to be outright shorting the market. However, it is a time when we have to significantly reduce risk by cycling into assets that historically perform better during unstable periods. Bonds, Utilities, and even Real estate to an extent have a proven history of performing better than equities in these ambiguous times. We'll get into Beta:SPX tomorrow in part 2, but getting closer to 0 Beta is ideal here.
5) Very High Volatility:
- Gold, Cash, Long Volatility, net short SPX exposure
As I mentioned, I don't like gold as a long term hold, and long volatility is a depreciating asset the vast majority of the time. However, when volatility is extremely elevated and the VIX futures are in backwardation, that is one of the rare times when I'm perfectly comfortable holding both.
I've never been a believer in the traditional "tail risk" strategies because they suffer the same problem as the buy and hold investor does. In many environments they are holding something that's not well suited to the current situation and will just constantly bleed capital.
I much prefer to be tactical with my tail risk allocations, and with an understanding of volatility markets and when to pull the tigger, we can get the best of both worlds. Tail risk protection during a crash, and no additional drag on the portfolio during stable times. Our Strategic Tail Risk strategy will do some heavy lifting during the next extended recession when it eventually and inevitably comes.
Again, for me personally it doesn't make sense to hold the same portfolio through all those volatility ranges when there is such variation in expected outcomes. With a little effort and out of the box thinking we can increase exposure to the positions that have the highest probability of success in the moment.
VTS Volatility Barometer
The actual method of dividing the market based on volatility levels is what my work has been focused on for over 15 years now. I share some of that information in the Volatility Dashboard articles and videos and there's many other metrics I will add to it over time.
The easiest and most comprehensive metric we have of course is the VTS Volatility Barometer. It takes all the most robust volatility metrics and combines them all into a single index. Make sure you check out the video if you haven't seen it, and for those who have it's still a good one to review every now and then.
Part 2 focusing on Beta : S&P 500 is coming tomorrow...
Take Control of your Financial Future!
Profitable strategies, professional risk management, and a fantastic community atmosphere of traders from around the world.
