
How exposed are you to a market crash?
Oct 21, 2025
VTS Community,
How exposed are we to the market?
One of the cornerstones of my work at VTS is the fact that within each of our tactical rotation strategies, we only hold the asset class that performs best given the current level of market Volatility.
I check the data once per day about 1 hour after the market opens and the strategies are allocated accordingly. We then come back the next day at the same time and check again. This means we will always be in what is historically speaking the best position at all times, and we can change on a 1 day timeframe as market Volatility changes.
Given that we're always optimizing our portfolio for what is currently happening, and we can easily move from aggressive positions to full on safety positions, it means our general exposure to the underlying market will change depending on what we're holding at the time.
One of the best ways to calculate our current market exposure is Beta
What is Beta?
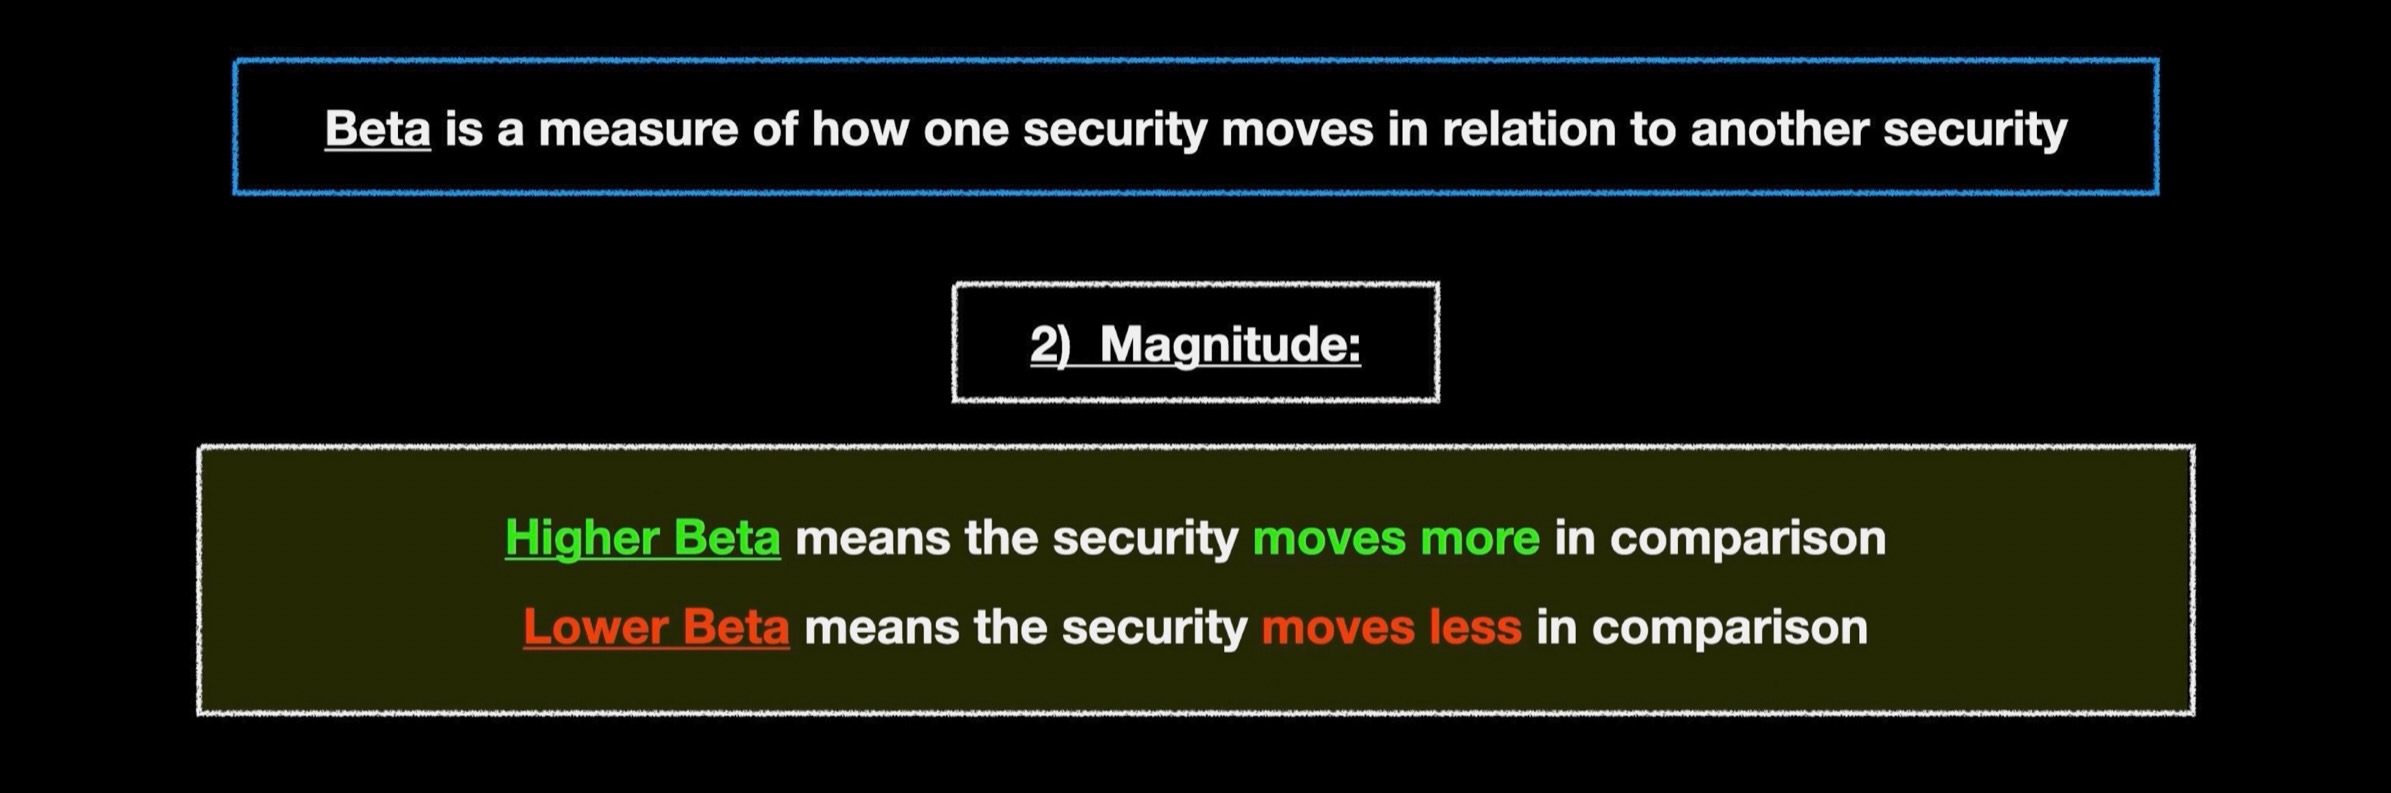
Beta measures the Volatility of one security in relation to another security, and measures both direction and magnitude
Direction:
- A positive Beta means they move in the same direction
- A negative Beta means they move in opposite directions

Magnitude:
- Higher Beta means the security moves more in comparison
- Lower Beta means the security moves less in comparison
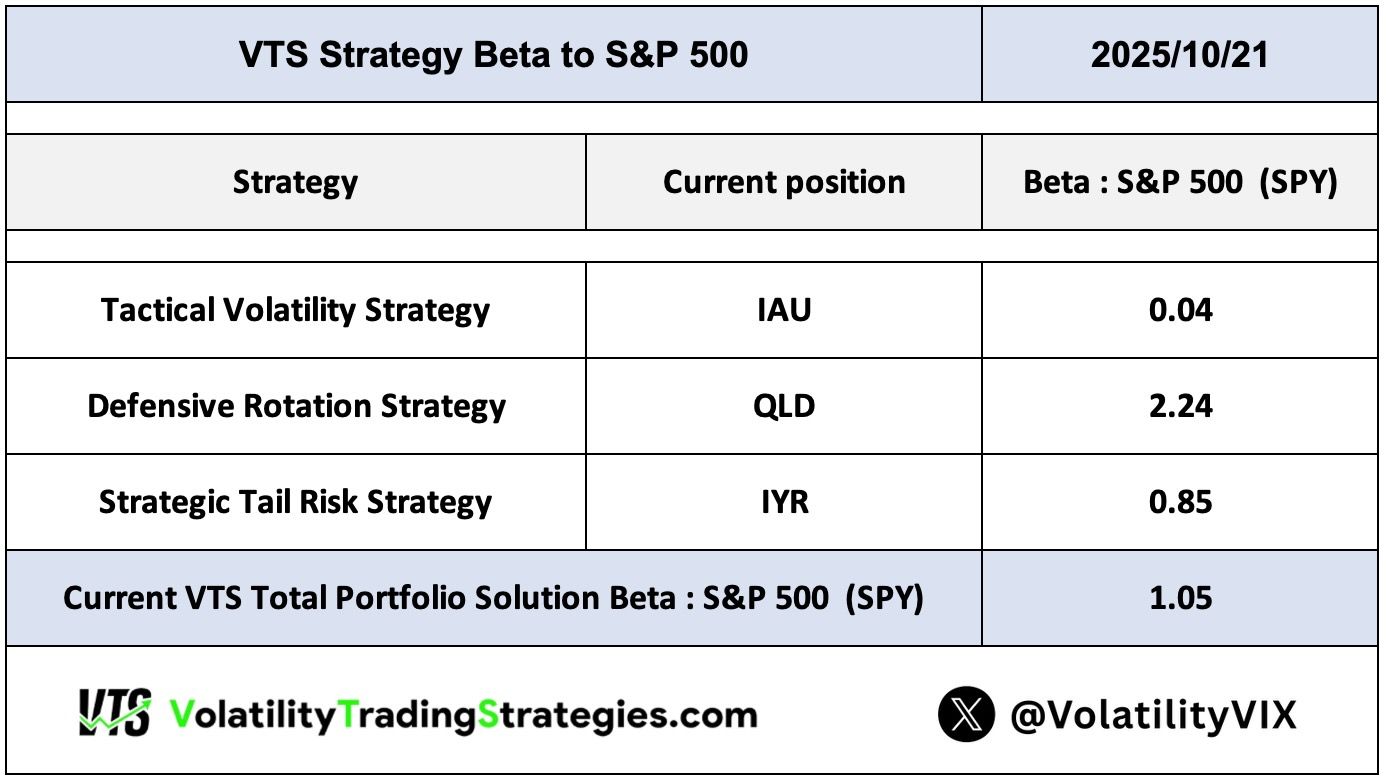
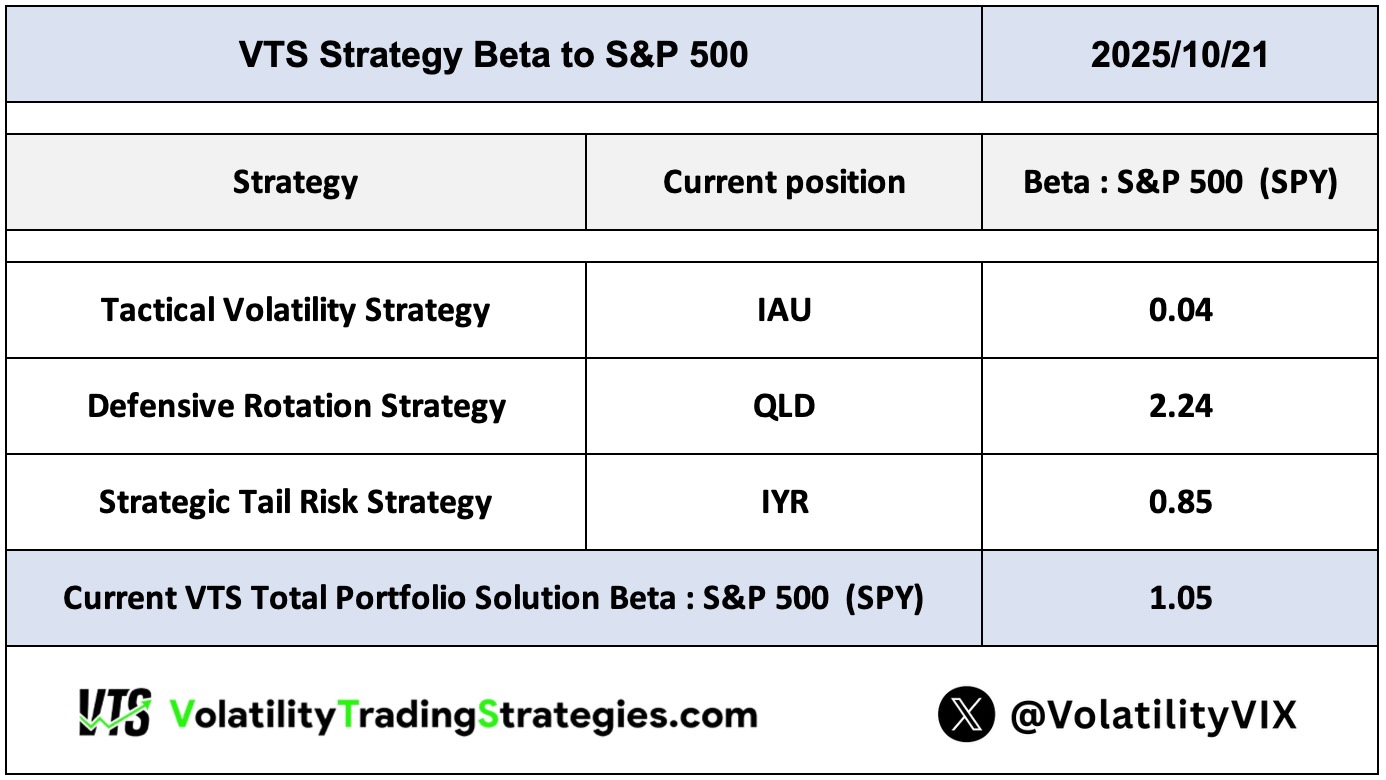
Now Beta can also be measured as a strategy, or a total portfolio, and within our Volatility Dashboard I always show the updated Beta factor of our VTS Total Portfolio Solution in relation to the S&P 500 every day.
As of today's email on October 21st, 2025, we are running about balanced exposure to the S&P 500 with a portfolio Beta : S&P 500 of 1.05
A few examples of potential Beta to illustrate:
- Positive Beta > 1 means our portfolio is expected to move in the same direction as the S&P 500, but with additional leverage greater than 1x
- Positive Beta between 0 & 1 means our portfolio is expected to move in the same direction as the S&P 500, but with reduced leverage less than 1x
- Negative Beta between -1 & 0 means our portfolio is expected to move in the opposite direction as the S&P 500, but with reduced leverage less than -1x
- Negative Beta < -1 means our portfolio is expected to move in the opposite direction as the S&P 500, but with increased leverage greater than -1x
Holding only the best asset given the current market
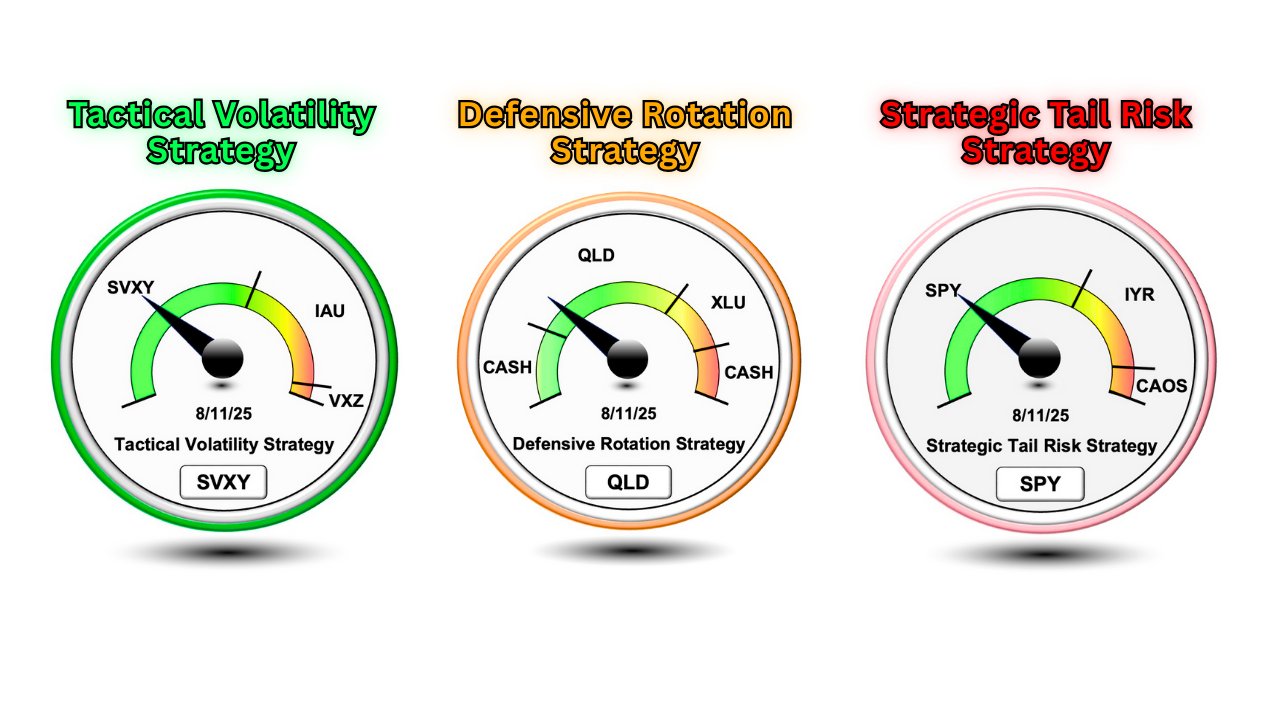
Our three tactical rotation strategies have different assets we will be holding given the current Volatility environment.
Tactical Volatility: Short Vol SVXY / Gold IAU / Long Vol VXZ
Defensive Rotation: 2x Nasdaq QLD / Utilities XLU / extremes Cash
Strategic Tail Risk: S&P 500 SPY / Real Estate IYR / Tail Risk CAOS
When I'm calculating the Beta : S&P 500 of those asset classes, I use a rolling 5-year time period so they will change a little over time. We can use overall Beta calculations to see how exposed we are to the market at any given combination of assets.
Of course there's many different combinations here and you can check our daily dashboard for the exact value, but let's talk about just the main 3.
Stable LOW Volatility markets
This is our most aggressive positioning when we're holding all three bullish positions, which pushes our Beta significantly higher than 1, meaning we are essentially leveraged to the S&P 500.
- If the S&P 500 goes up 1%, we can expect our portfolio to go up roughly 1.64%

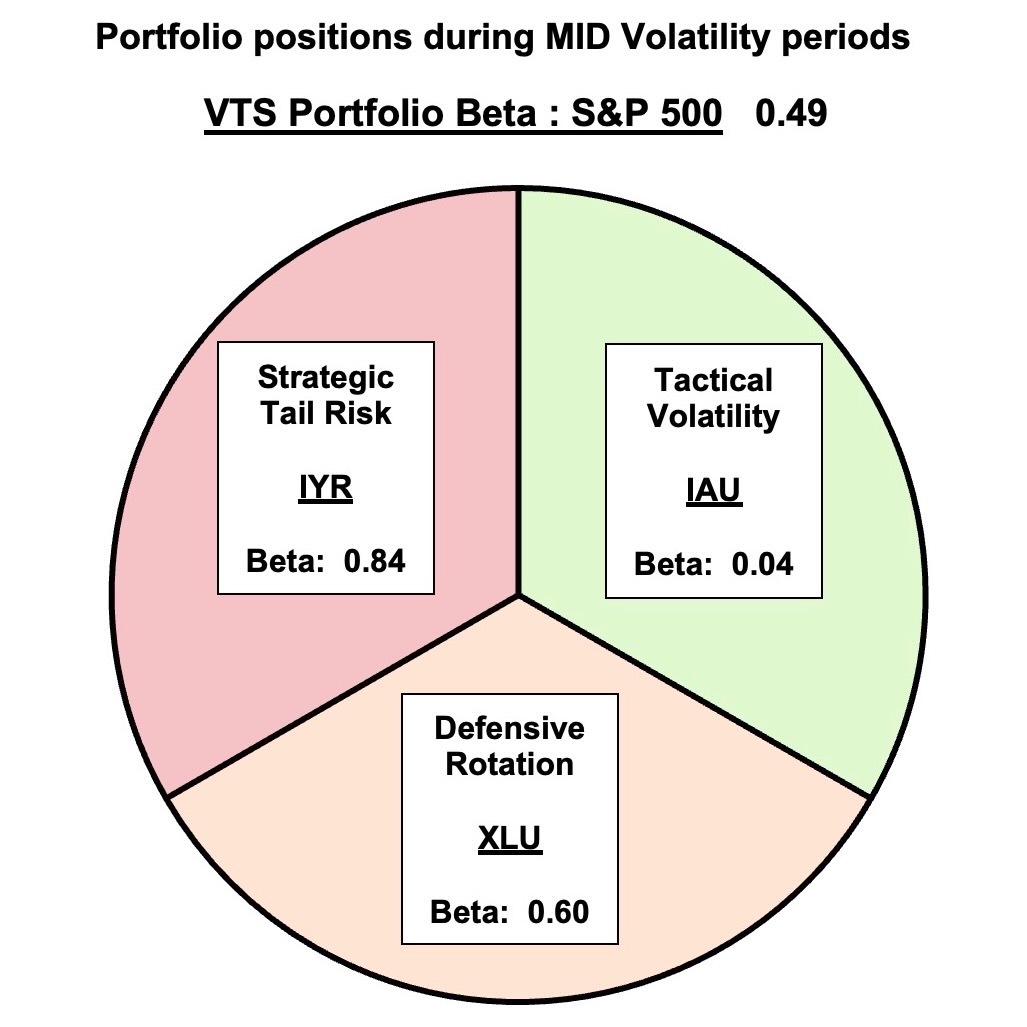
Ambiguous MID - HIGH Volatility markets
When market risk is rising but has not yet reached the level of full on panic, we will just shift to our safety positions. As far as Beta goes, the goal here is to reduce it significantly below 1 so we are less exposed to anything bad that's about to happen.
- If the S&P 500 goes down 1%, we can expect our portfolio to only drop about 0.49%
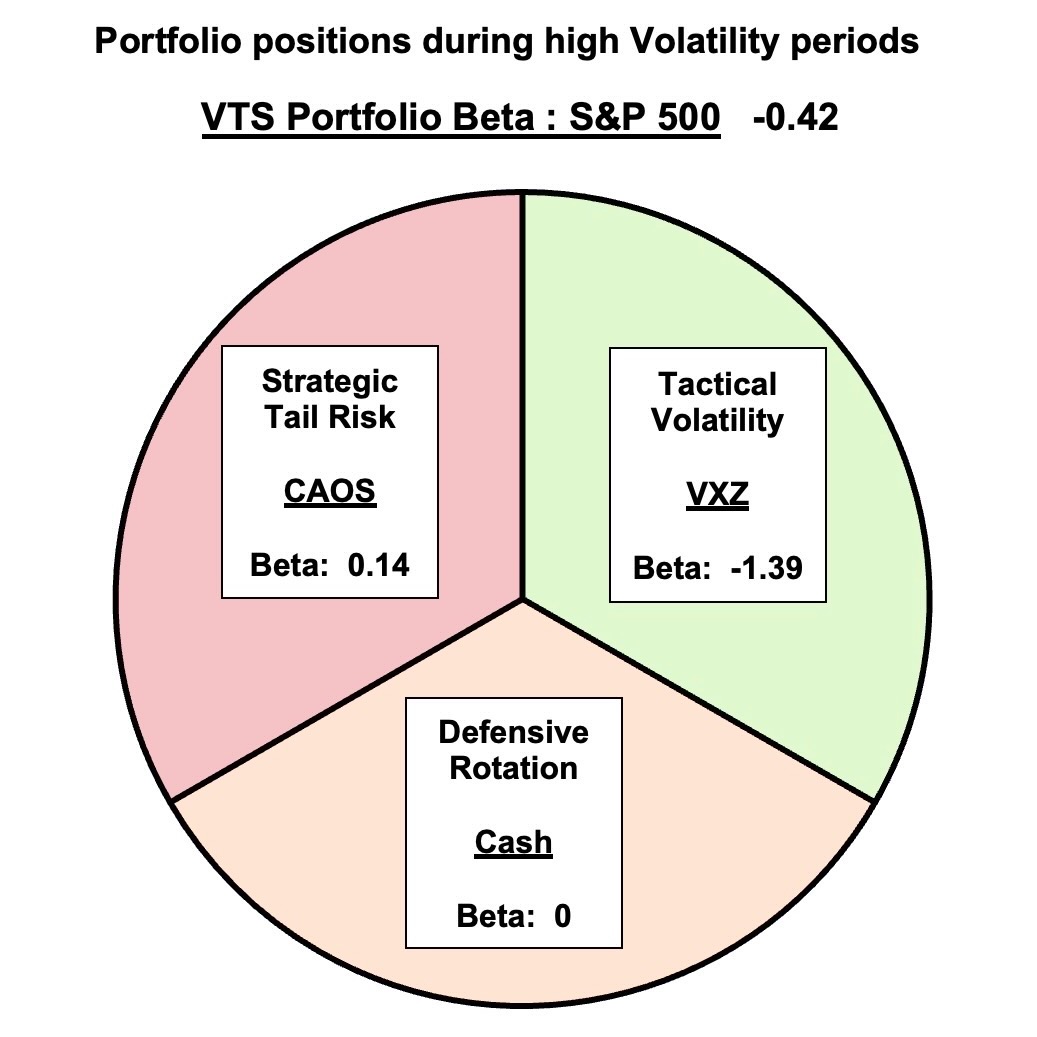
Extreme HIGH Volatility markets
This is now for those periods when Volatility is screaming warnings, and in these rare times we will actually be holding positions that will profit from a market crash.
Think Covid in 2020, 2018 Volpocalypse, 2015 China hard landing, 2011 European Debt Crisis, 2008 Financial Crisis, and whatever the next major market crash will be called when it eventually (maybe soon?) happens.
- If the S&P 500 goes down 1%, we can expect our portfolio to profit 0.42%
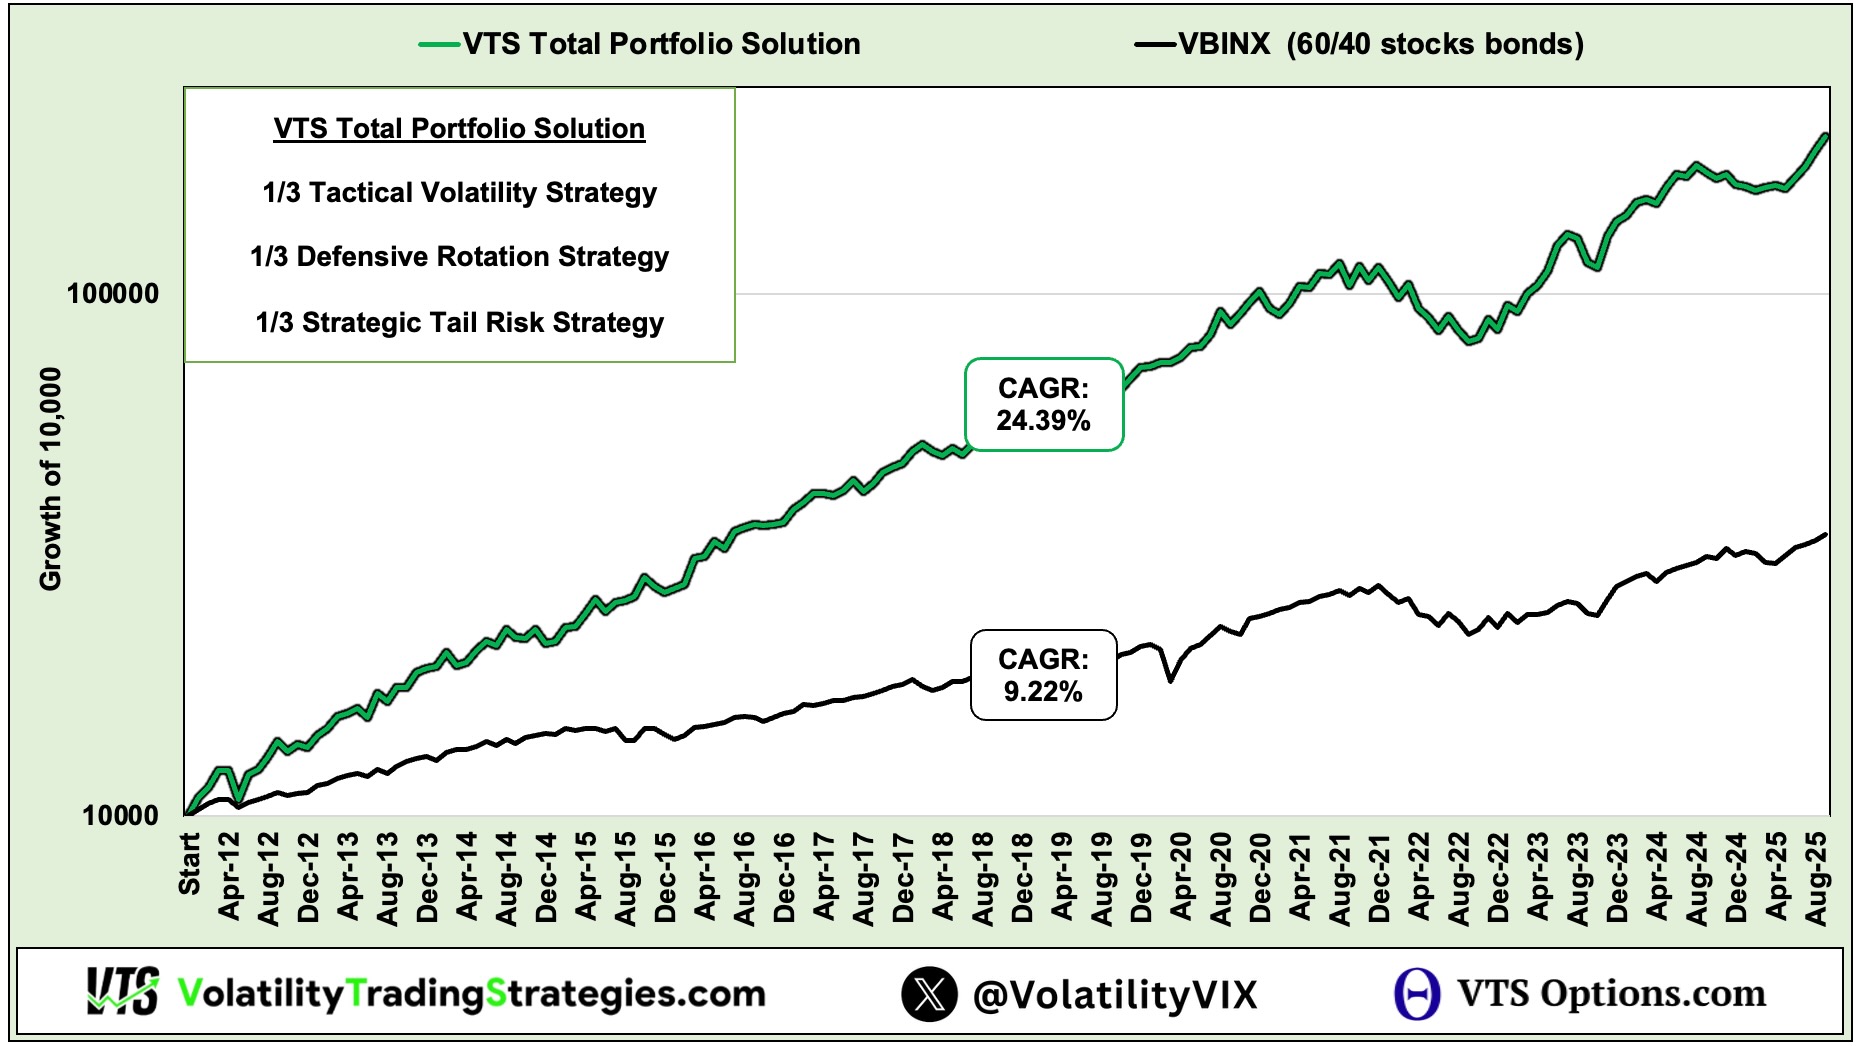
Buy & hold is for rookies!
Learning how to read the tea leaves of Volatility means we don't have to ride the stock market roller coaster of good performance in bull markets and devastating performance in bear markets.
We're nimble and we can shift into the best positions every day, and actively control our exposure to the S&P 500 through Beta factor.
Take Control of your Financial Future!
Profitable strategies, professional risk management, and a fantastic community atmosphere of traders from around the world.
