
Part 2 - 5 Volatility Ranges - Our Beta : SPX Exposure During Each
Feb 17, 2022VTS Community,
In Part 1 of this article yesterday (read Part 1 here if you missed it) we talked about why "Buy and Hold" investing is a poor way of navigating the market. Essentially, we already know that the various asset classes will perform substantially different in different volatility environments. The S&P 500 for example is a much riskier position during high volatility than it is during low volatility. Gold is a much better position during high volatility than it is during mid to low volatility. This applies to all asset classes. They all have periods where we expect them to perform well, and periods where they will have a headwind.
It makes no sense to hold the same portfolio with the same allocations through all the various volatility regimes. The assets that are performing well would be unnecessarily dragged down by the ones that aren't, and reduce performance of the overall portfolio in the long-run.
That's why tactical investing is superior. We can analyze historical data and determine when the best and worst periods are for each asset class. Then we just focus on holding only the positions that have a higher probability of success, and reduce exposure or completely cycle out of the assets that have a low probably of success. It's not a perfect solution and there are times we get it wrong, but in the long-run over multiple different volatility regimes the advantage becomes clear.
Today we'll continue the discussion and show the asset classes and general expected Beta exposure our portfolio will carry through 5 general volatility regimes.
Beta : S&P 500:
First, we have to review Beta and how to interpret it because it's an excellent metric for determining our portfolio exposure. In fact, Beta will be part 7 of the Volatility Lingo video series so expect that video to be out soon. If you want to review the first 6 parts so far, here's a playlist.
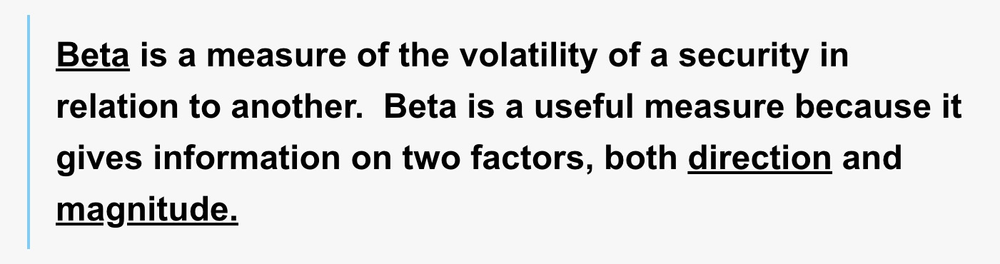
Direction:
Positive Beta values mean the two securities move in the same direction. As an example, the MDY has a positive Beta value because the MDY moves in the same direction as the S&P 500 on average in the long run. When SPX goes up, MDY typically goes up. When SPX goes down, MDY typically goes down as well.
Negative Beta values mean the two securities move in the opposite direction. For example, the VXX has a negative Beta value because VXX moves in the opposite direction as the S&P 500 on average in the long run. When SPX goes up, VXX typically goes down. When SPX goes down, VXX typically goes up.
Magnitude: Beta values greater than 1 mean the security moves more than the underlying security on average in the long run. For example, MVV has a Beta greater than 1 because it is the 2x leveraged version of the S&P 400 MidCap index and as such, will move much more than the 1x leveraged SPX. Beta values less than 1 mean the security moves less than the underlying security on average in the long run. For example, the 7-10 year US Treasury IEF has a Beta less than 1 because it moves far less day to day than the SPX does. Example: The MVV Beta to the S&P 500 is showing how much the MVV moves in relation to the SPX, and that value as of today is 2.02. Remember that value tells us two things: - First, 2.02 is a positive number which means the MVV typically moves in the same direction as the SPX. On days where the SPX is up 1%, we would expect on average the MVV would be positive as well. - Second, 2.02 is greater than 1 which means MVV typically moves more than the SPX. On days where the SPX is up 1%, we would expect on average the MVV would be up more than 1%. So Beta is an extremely useful metric for everyone to become familiar with and I personally use it in several different applications within my investing.
Current VTS Leveraged Total Portfolio:

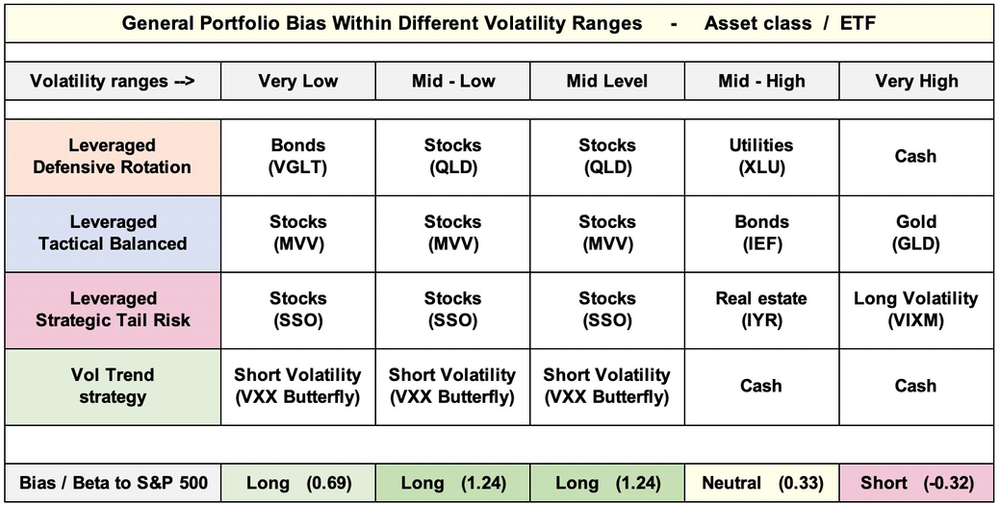
We're now running 4 strategies with equal 25% weighting as above, and we can review what positions each of those strategies will likely be holding within each of the 5 volatility ranges. This will give us a much better idea of exactly when we will be aggressive, and when we are on the defensive.
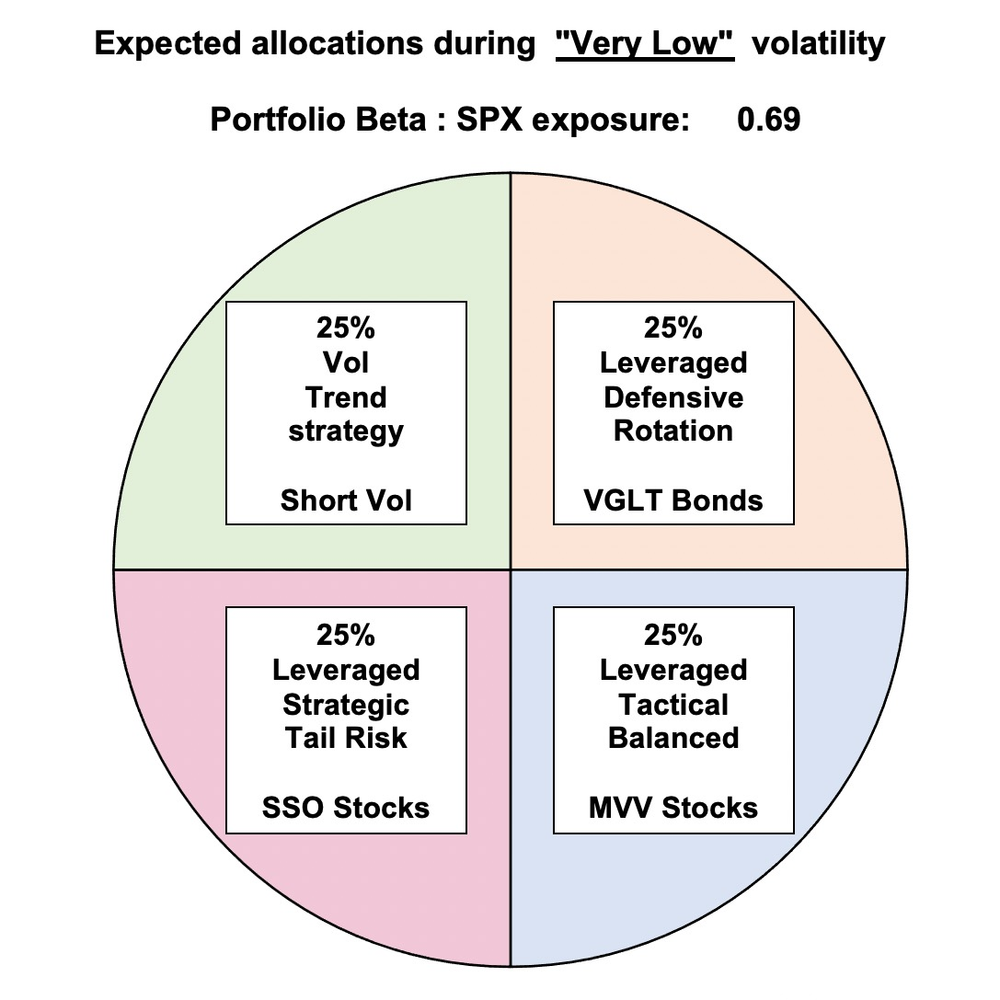
With volatility low and markets stable, we can be reasonably aggressive in this range. Now in order for the market to get within this low vol range it does mean that the stability has likely persisted a while. That's not a signal that a reversal is imminent, but it does mean that there may be diminishing return going forward. That's why the Defensive Rotation strategy adds a little Bond exposure, and the Vol Trend strategy will shift the Delta exposure of the VXX Butterfly's a little more positive than normal.
0.69 Beta : SPX exposure. Remember, a positive number means it moves in the same direction as the S&P 500, making our portfolio still solidly net long the market with about a 70% leverage factor. Enough to benefit from further strength, with reduced exposure if the market happens to be running on fumes.
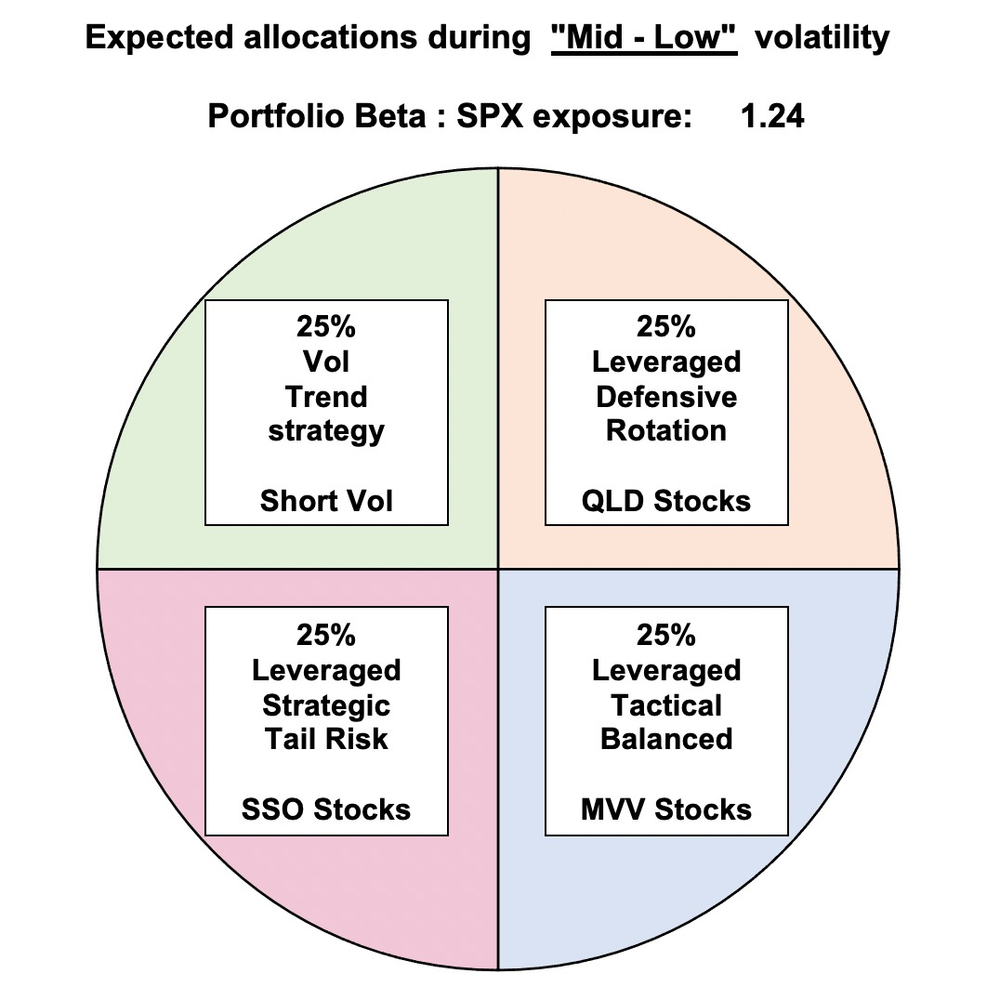
Mid - Low volatility is the range I feel most confident in being aggressive with my portfolio. It's essentially a full green light to not only hold equities, but to actually use the 2x leveraged versions. I don't ever use 3x leveraged ETFs as those are too risky on one day shock moves, but the 2x leveraged ETFs can be used strategically to great effect. It's also a time where there will be significant roll yield in the VIX futures market, making it the sweet spot for the "Short Vol" trade as well.
1.24 Beta : SPX exposure. Remember, Beta greater than 1 means it actually moves more than the S&P 500, and this is due to our use of the 2x leveraged ETFs in this ideal mid - low vol range.
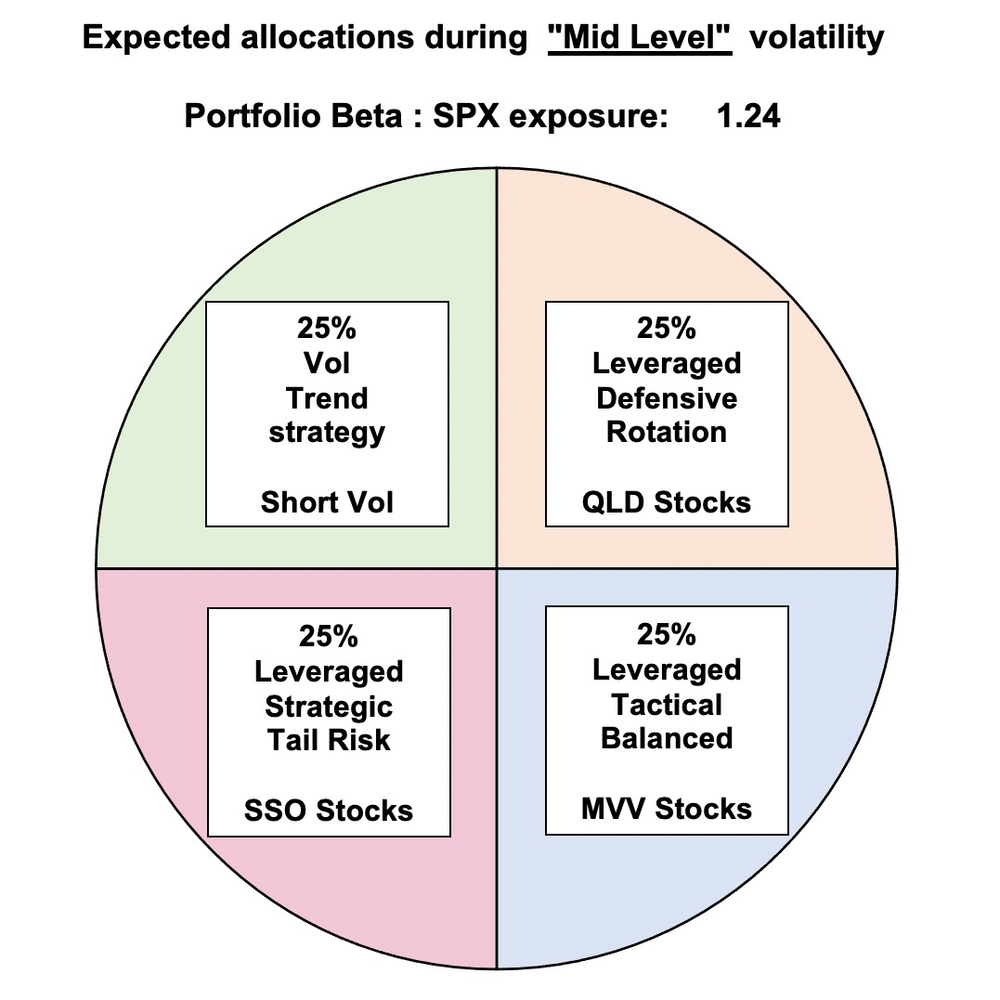
While mid level volatility is approaching the range where we will start moving to safety, from a historical data perspective it's also an advantageous range to be aggressive and there's no difference in expected allocations for our portfolio compared to mid - low volatility. The whole 20 - 60% range is green light territory and we're still going to be using 2x leveraged equity ETFs as well as being short volatility.
1.24 Beta : SPX exposure. Positive, and greater than 0, this has us leveraged net long the market.
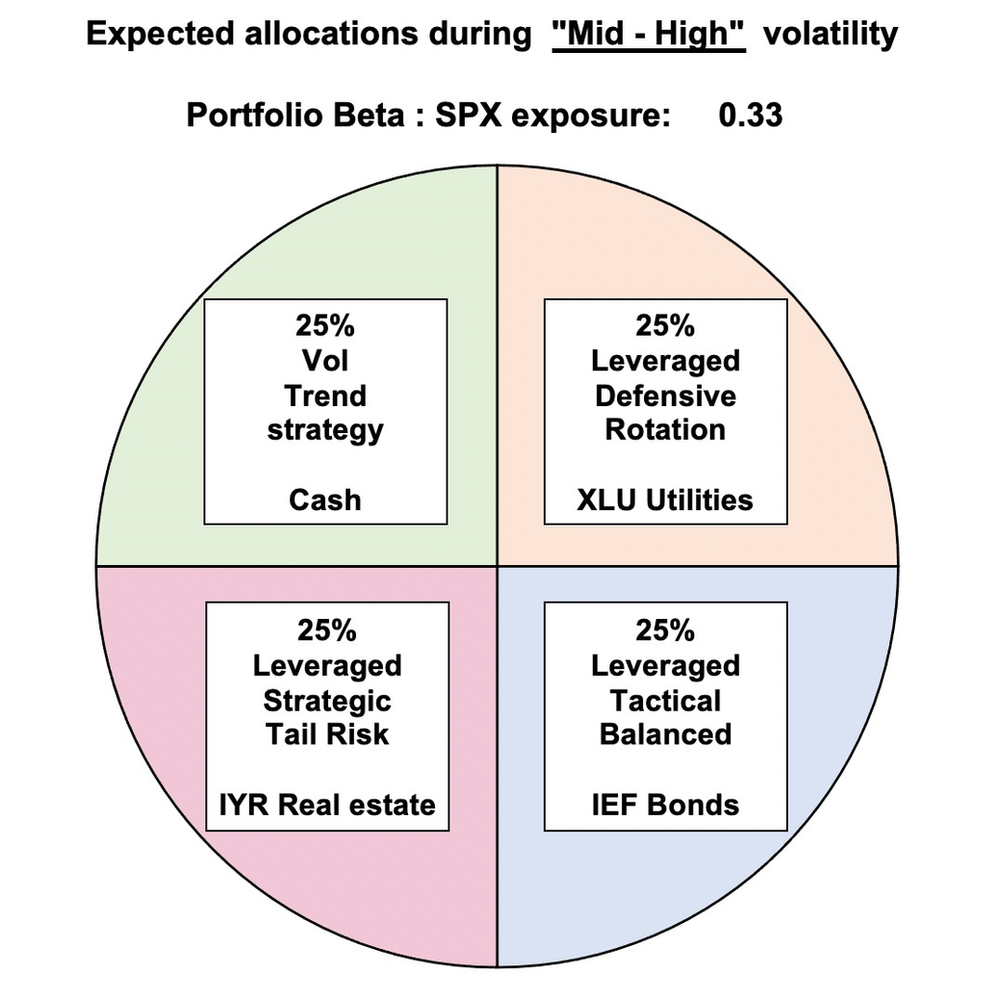
Definitely too early to start taking outright net short positions, but with volatility elevated in the mid - high range we have to rotate out of aggressive equity and short vol positions and replace them with assets that tend to move slower. Utilities and Real estate are still both positive Beta, but they do perform better in this range than equities do. We also throw in some short term Treasury IEF exposure and cash as well to make sure if the market does get even weaker, we can cushion the blow.
0.33 Beta : SPX exposure. We may still be slightly net long the market, but overall we're trying to target as close to 0 Beta as possible here.
The average recession cycle in the United States is roughly 6-7 years. So while they are rare, investors should absolutely expect that at some point we're going to suffer a multi month, and perhaps multi year long decline. Both the government and the Fed blew out their budgets spending trillions to save the US from that fate during the pandemic in 2020. While I don't have a crystal ball, I suspect the same tools will not be available the next time around.
I never hope to see recessions because of how many people get hurt by them, but the truth is they can be a time for savvy investors to take advantage of the crisis. If positioned right with some net long volatility exposure, not only can investors side step the panic, but there's actually an opportunity for profit.
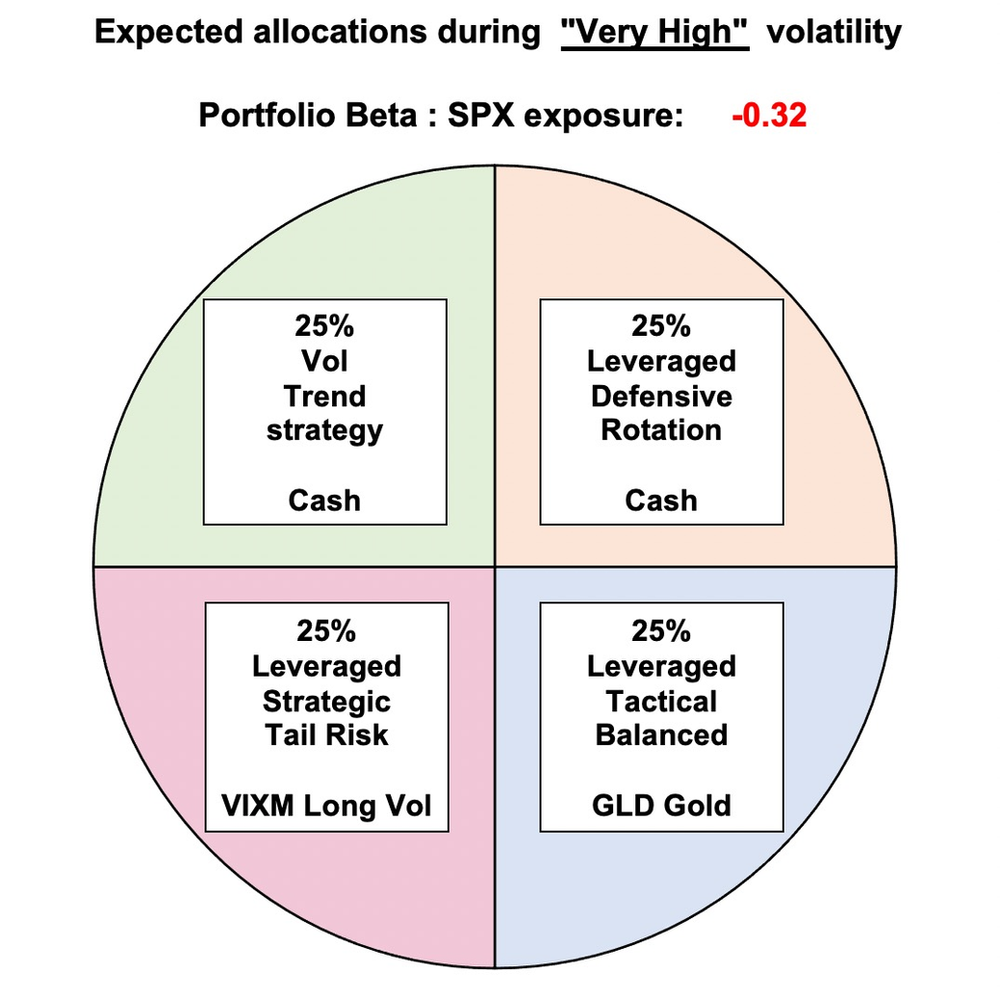
Cash, Gold, and Long Volatility VIXM will be our positions of choice to ride out the storm. They can be a wild ride day to day as well, but historically they perform significantly better than equities. In a world with very few true "safety" positions left, I'll take my chances being net short Beta.
-0.32 Beta : SPX exposure. There can be a lot of whipsaw in recessions so I don't get overly aggressive with the shorting. -0.32 Beta is plenty to profit from any calamity.
Is the high volatility range now the most important?
I suspect the next time around the S&P 500 won't stop at a -35% decline like it did in 2020 and things will get substantially worse than that. And not to be too doom and gloom, but I have no idea how the government and Fed will prevent a multi year depression. It's easy to see why the "green light kill zones" of mid - low volatility are great for performance, but going forward that high volatility range may start paying dividends as well.
It take some courage to go long volatility when the signals flag because no doubt there is some whipsaw potential. There may still some buy the dip mentality out there which can lead to some quick in and back out false positive signals. However, given how weak the global economy is, I feel like it's important to risk small bleeds of capital to eventually get the big payoff when this whole house of cards finally collapses.
I'm an optimist I swear! I just don't see any way the bubbles in stocks, real estate, and crypto/NFT's don't pop and pop huge at some point.
Take Control of your Financial Future!
Profitable strategies, professional risk management, and a fantastic community atmosphere of traders from around the world.
